. 2022 Sep 2;11:e75908. doi: 10.7554/eLife.75908

Figure 4. Acetate secretion is linked to ROS transfer from AML to stromal cells.

(A) Extracellular acetate levels in SKM-1 (black) and MS-5 cells cultured alone (dark grey) and in co-culture (light grey) for 24 hr in a control medium, medium with 50 µM H2O2 or medium with 5 mM NAC. (B, C and D) Intracellular ROS levels measured by H2DCFDA staining in B and D AML cells or C primary patient-derived AML cells and MS-5 cells cultured alone and in co-culture in B and C direct contact. For A, and B, bars represent the mean of n=3 independent experiments and error bars represent standard deviations. For A, a Dunnett’s multiple comparisons test was performed comparing each condition (H2O2/NAC) was compared to untreated; for B and D, an unpaired t test with Welch’s correction was applied comparing co-culture conditions to cells cultured alone. p-Values are represented by n.s. for not significant, * for p-value <0.05, and ** for p-value <0.01.

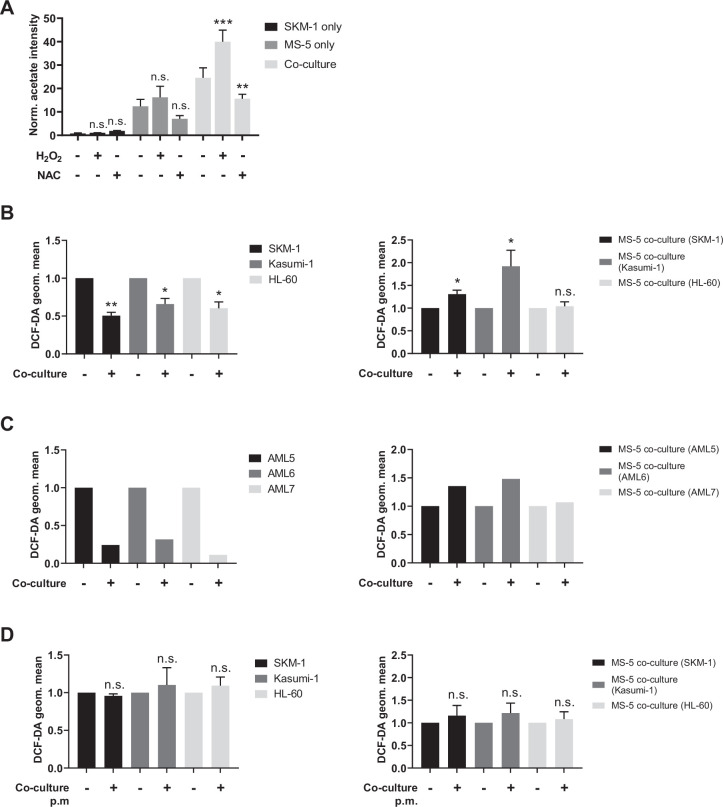
Figure 4—source data 1. Values and tats for panels included in Figure 4.

Figure 4.

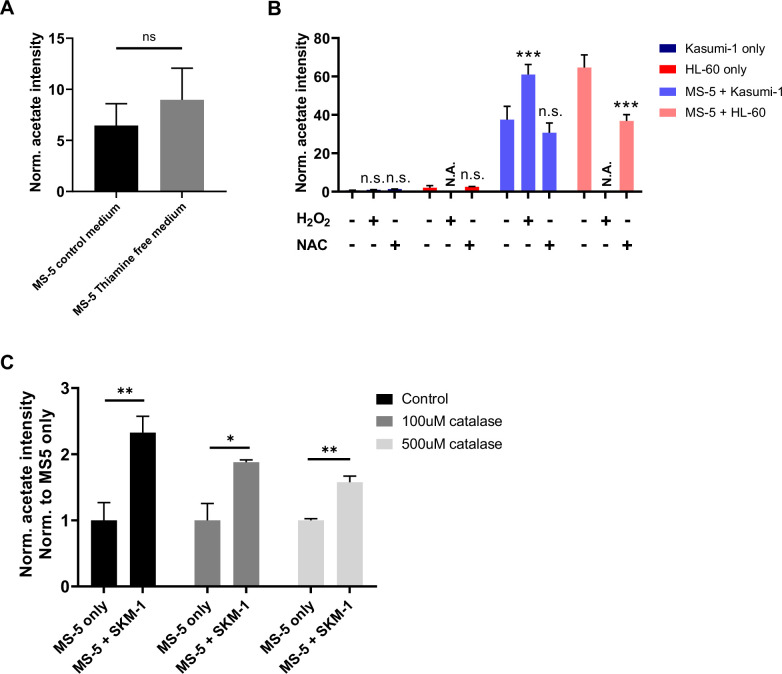
Figure 4—figure supplement 1. Acetate secretion in thiamine free medium and after modulating ROS levels.

Figure 4—figure supplement 1.

(A), Extracellular acetate levels in MS-5 cells cultured in control medium (black) or in thiamine-depleted medium (grey) after 24 hr. (B), Extracellular acetate levels in Kasumi-1 (navy blue) and HL-60 (red) cultured alone and in co-culture (light blue and light red) for 24 hr in a control medium, medium with 50 µM H2O2 or medium with 5 mM NAC. Acetate levels for HL-60 cells cultured alone or under co-culture with 50 µM H2O2 are not shown as treatment 50 µM H2O2 severely impaired their viability. N.A.=not analysed. (C), Extracellular acetate levels in SKM-1 cultured alone and in co-culture for 24 hr in a control medium and medium with 100 µM or 500 µM catalase. For A and B each bar represents the mean of n=3 independent experiments and error bars represent standard deviation. For A and C, an unpaired Student’s t-test was applied for each condition. For B, a Dunnett’s multiple comparisons test was performed for Kasumi-1 and a Sidak’s multiple comparisons test was performed for HL-60. p-Values are represented by n.s. for not significant. * for p-value <0.05, ** for p-value <0.01 and *** for p-value <0.001.
Figure 4—figure supplement 1—source data 1. Acetate values and stats for MS5 cells in thiamine-free medium vs control (A), for Kasumi and HL-60 +/-NAC or H2O2 alone vs coculture (B), and for MS-5 cells with different concentrations of catalase (C).