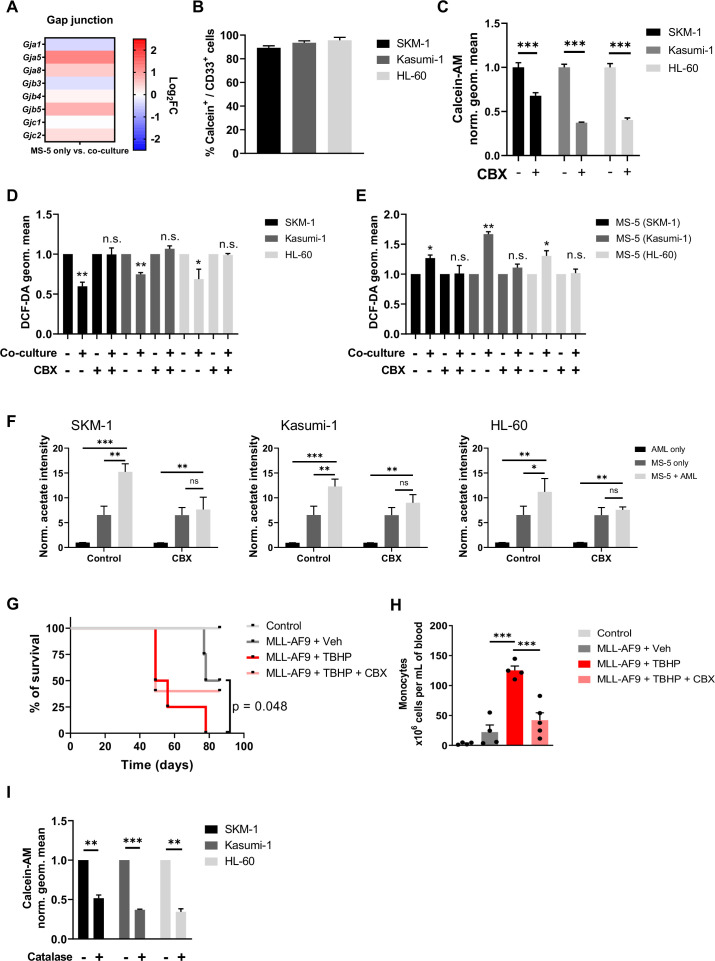
Figure 5. Acetate secretion is linked to ROS transfer from AML to stromal cells via gap junctions.
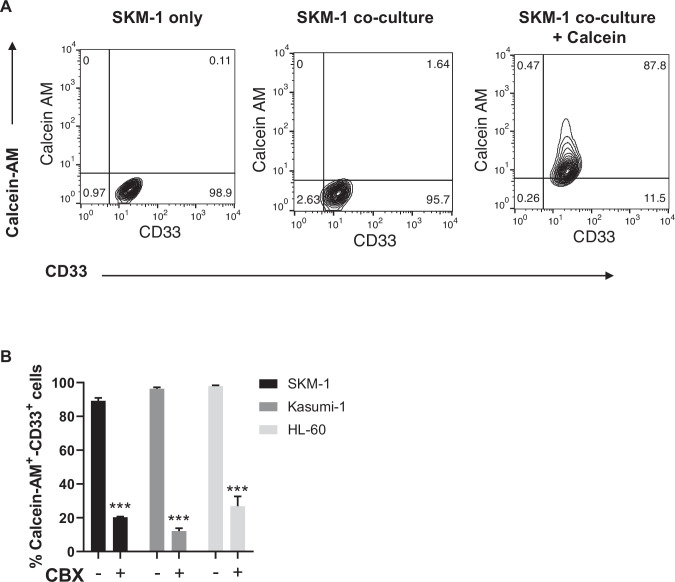
(A) Fold change (FC) values of detected gene transcripts (TPMs) related to gap junctions. FC values are represented as log2FC, red values indicate upregulation and blue values indicate downregulation in MS-5 cells in co-culture. (B) Frequencies of Calcein-AM and CD33 positive AML cell lines after being in co-culture with Calcein-AM stained MS-5 cells for 3 hr . (C) Geometric mean of Calcein-AM fluorescence in CD33 positive AML cells (treated or untreated with 200 µM carbenoxolone for 24 hr) after being in co-culture with Calcein-AM stained MS-5 cells for 3 hr . (D and E) Intracellular ROS levels measured by H2DCFDA staining in D AML cells and E MS-5 cells cultured alone and in co-culture in direct contact treated or untreated with 200 µM carbenoxolone for 24 hr. (F) Extracellular acetate levels in AML cells (black) and MS-5 cells cultured alone (dark grey) and in co-culture (light grey) for 24 hr in a control medium, or medium with 200 µM CBX. (G) Survival rate of C57BL6/J mice transplanted with bone marrow nucleated cells isolated from WT control or MLL-AF9+ leukemic donors, treated with 500 µmol/kg of ROS-inducer tert-Butyl hydroxyperoxide (TBHP) alone or in combination with 30 mg/kg of gap-junction inhibitor carbenoxolone (CBX). Statistics indicate results of log-rank test for comparisons of Kaplan-Meier survival curves versus recipients of MLL-AF9+ cells treated with vehicle. (H) Number of monocytes per mL of peripheral blood (PB) at endpoint analysis, measured with Procyte hematological analyzer (IDEXX BioAnalytics). (I), Geometric mean of Calcein-AM fluorescence in CD33 positive AML cells (treated or untreated with 500 µM catalase for 24 hr) after being in co-culture with Calcein-AM stained MS-5 cells for 3 hr. For (B, C, D, E, F, H and I) bars represent the mean of n=3 independent experiments and error bars represent standard deviations. For (C, D, E, F, H and I) an unpaired Student’s t-test was applied for each condition. For G, a Gehan–Breslow–Wilcoxon test was applied. p-Values are represented by n.s. for not significant, * for p-value <0.05, ** for p-value <0.01 and *** for p-value <0.001.


