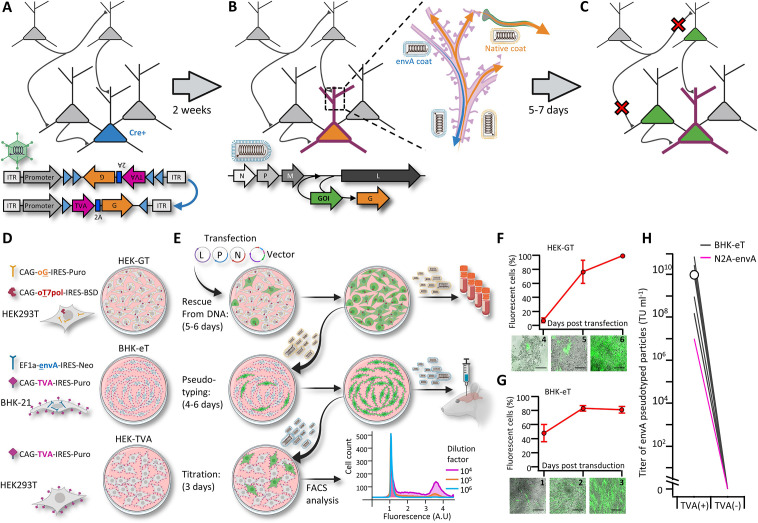
Figure 1. A new viral packaging system for fast, clean and high-throughput production of RVdG-CVS-N2c vectors.
(A–C) A schematic representation of the experimental workflow for achieving cell type-specific trans-synaptic retrograde labeling using G-deleted, envA-pseudotyped rabies viral vectors: Genetic dissection of cre+ neurons (blue) for conditional expression of TVA and G (A); targeting of RVdGenvA particles to labeled neurons for expression of a gene of interest (GOI), (B) and subsequent propagation of native-coat RVdG particles from starter cells to their presynaptic partners (C). (D) A schematic representation of the three different cell lines designed for rescue (HEK-GT), pseudotyping and amplification (BHK-eT) and titration (HEK-TVA) of RVdG viral particles, alongside the transgenes used to generate them. (E) Schematic representation of the production process and timeline. L,P and N represent the plasmids encoding the corresponding rabies genes and V represents the vector plasmid. (F) Quantification of the time course for the rescue stage, starting at day 4 after transfection of viral plasmids. (G) Quantification of the time course for amplification of pseudotyped particles, starting at day 1 after transduction with native-coat particles. (H) Quantification of the average titer of concentrated pseudotyped stock from 19 individual productions, with comparison to the titer of a representative production of RVdg-CVS-N2c virus, produced using N2a cells (magenta). Lines represent titers of individual productions. Data in F and G represents the average and SEM of three individual and independent measurements.


