. 2022 Aug 30;11:e79848. doi: 10.7554/eLife.79848

Figure 3. Retrograde labeling efficiency is determined by the viral strain, and not the packaging cell lines.

(A) Schematic illustration of the injection scheme, designed for comparison of retrograde labeling efficacy between CVS-N2c vectors produced using either the N2a-based or BHK-based packaging cell lines, propagating using the N2c glycoprotein. (B) Representative confocal images of the ipsi- and contra-lateral hippocampus. Expanded images of the CA3 region of both hemispheres and the CA1 of the injection site correspond to the areas delineated by cyan rectangles. (C) Representative confocal images of the LEC (top) and the septal complex (bottom). (D–F) Same as (A–C) but for comparison of CVS-N2c and SAD B19 vectors, both produced with BHK-based packaging cell line and propagating using the SAD-B19 optimized glycoprotein (oG). (G) Summary bar plot showing the ratio of first order starter cells in the CA1 pyramidal layer, between neurons labeled with either CVS-N2cN2a (blue) or SAD B19BHK-et (orange) and the neurons labeled with CVS-N2cBHK-et. (H) Summary bar plot showing the differences in retrograde labeling efficiency, under both injections schemes described in (A) and (D). All values were normalized to the ratio of starter cells shown in (G). N=4 and 3 animals for the N2c-N2c and N2c-B19 comparisons, respectively. Data shown as mean and SEM with black circles denoting individual animals.

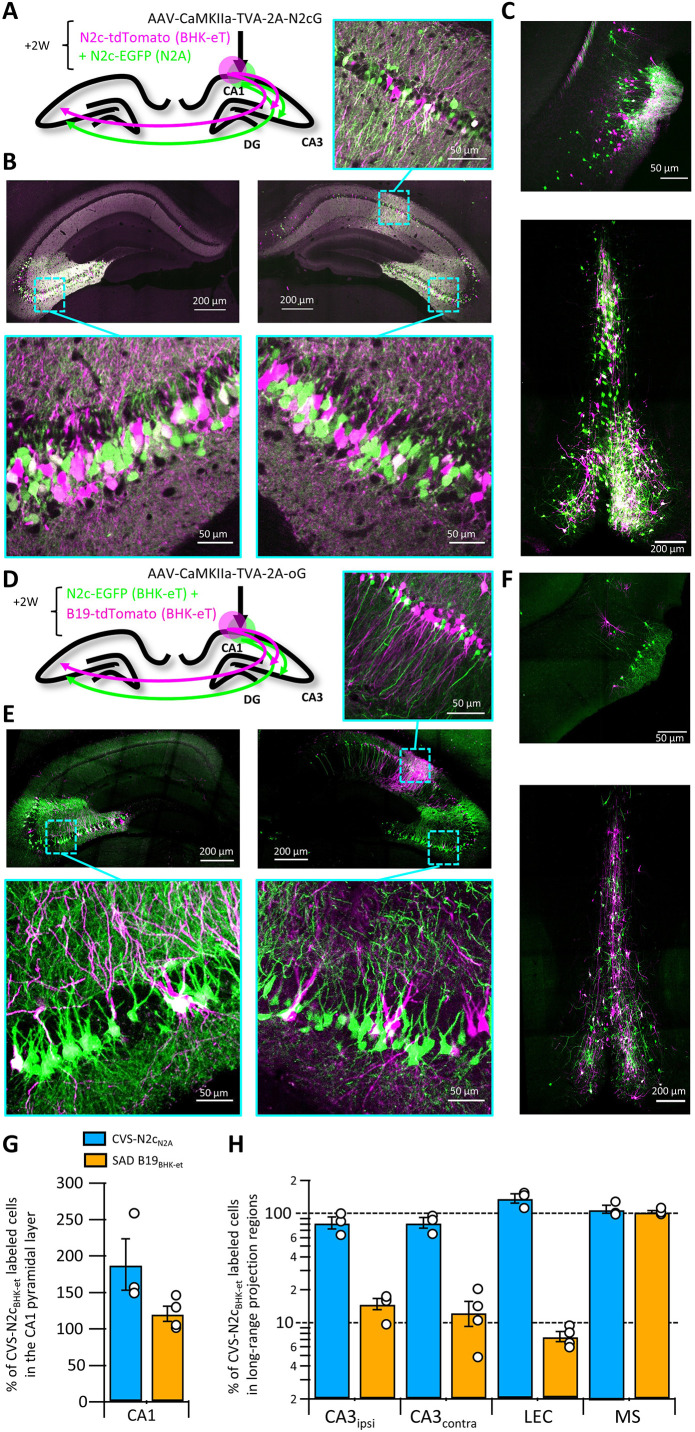
Figure 3—source data 1. Cell count for experimental designs and ratio calculations.
Two tables on top of page show the number of labeled cells per region for each individual slice and animal. Table on left shows data corresponding to Figure 3A–C and table on the right shows data corresponding to Figure 3D–F. Below each table are the calculated averages for each condition shown in Figure 3G and H.

Figure 3.

Figure 3—figure supplement 1. Differential effects of N2c and B19 glycoproteins on propagation efficiency of CVS-N2c vectors.

Figure 3—figure supplement 1.

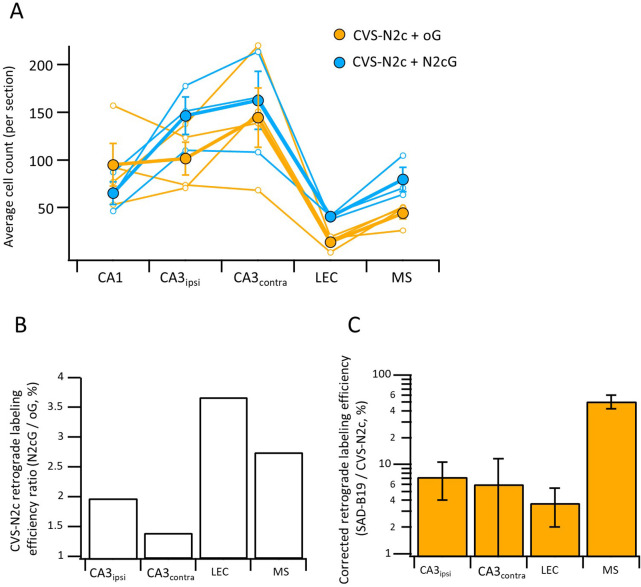
(A) Average neuron count per slice for individual animals (empty circles) and averaged count for all animals (full circles) in the different regions projecting to the CA1 following retrograde labeling with CVS-N2c vectors using either the B19-oG (orange) or the N2cG (cyan). (B) Ratio of 2nd order neurons between the two conditions in (A), normalized by the number of putative starter neurons in the CA1 pyramidal layer, demonstrates higher efficacy of propagation under the N2cG, for all regions tested. (C) Retrograde labeling efficacy ratio between CVS-N2c and SAD-B19 vectors shown in Figure 3H, corrected for the added effect of the glycoprotein to the propagation efficacy of the CVS-N2c vectors by dividing the values for the SAD-B19 condition in Figure 2H, with the corresponding ratio estimates measured in (B).