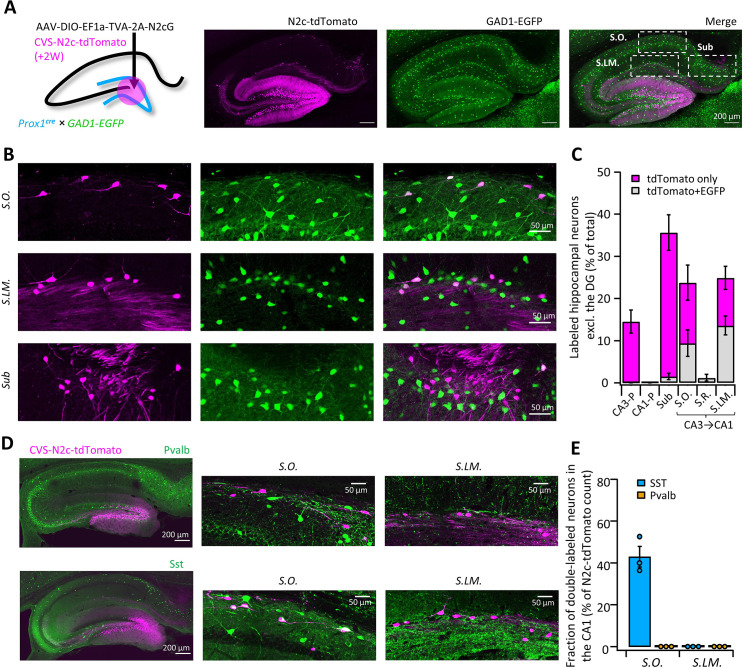
Figure 4. High-throughput retrograde labeling with CVS-N2c enables identification of non-canonical projections to DGCs.
(A) Schematic illustration and representative confocal images, describing the injection scheme designed to target DGCs for retrograde labeling in an interneuron reporter line. (B) Representative confocal images (left) of the regions highlighted in (A) showing retrogradely-labeled neurons along specific hippocampal layers and their overlay with the interneuron-specific marker. (C) Summary bar plot showing the distribution of DG-projecting hippocampal neurons outside of the DG (magenta) and of them, the fraction of double-labeled neurons (grey). Calculation of cell numbers in the dendritic cell layers combined cells along the entire proximo-distal hippocampal axis, from CA3 to CA1. N=189 cells from 3 animals. (D) Representative parasagittal sections of the hippocampus following retrograde labeling from the DG with CVS-N2c-tdTomato, along with immunolabeling of parvalbumin (Pvalb, top) and Somatostatin (Sst, bottom). Expanded view of the S.O. and S.LM. are shown to the right of each image. (E) Summary plot describing the proportion of Pvalb- or Sst-positive neurons of the total CVS-N2c labeled neurons in the S.O. or S.LM. of the CA1. N=125 cells from three animals.


