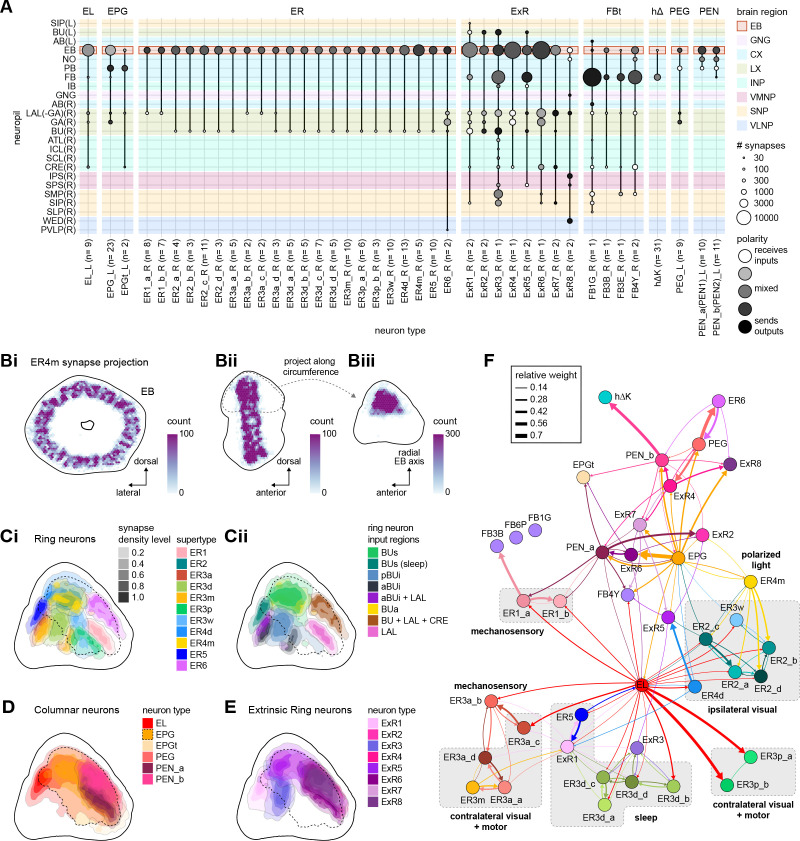
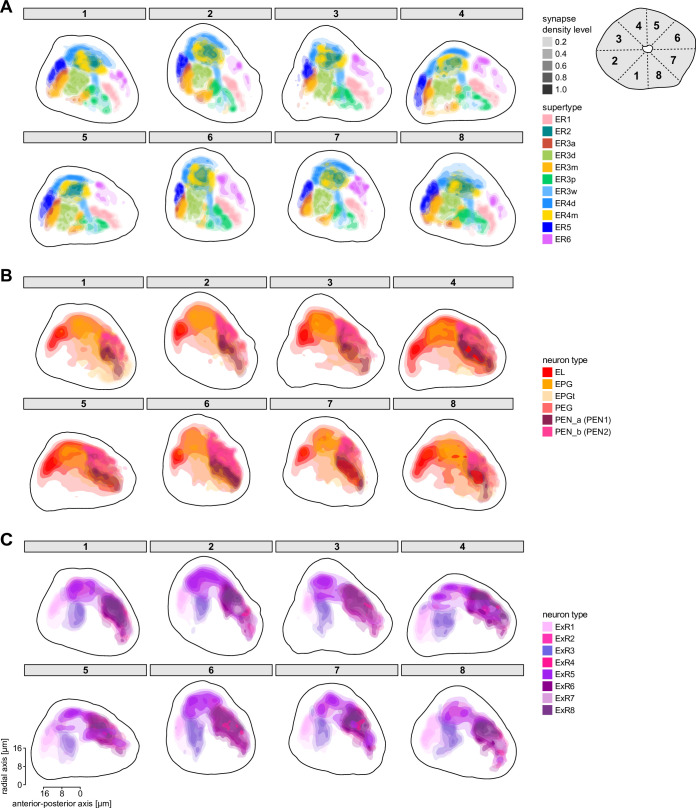
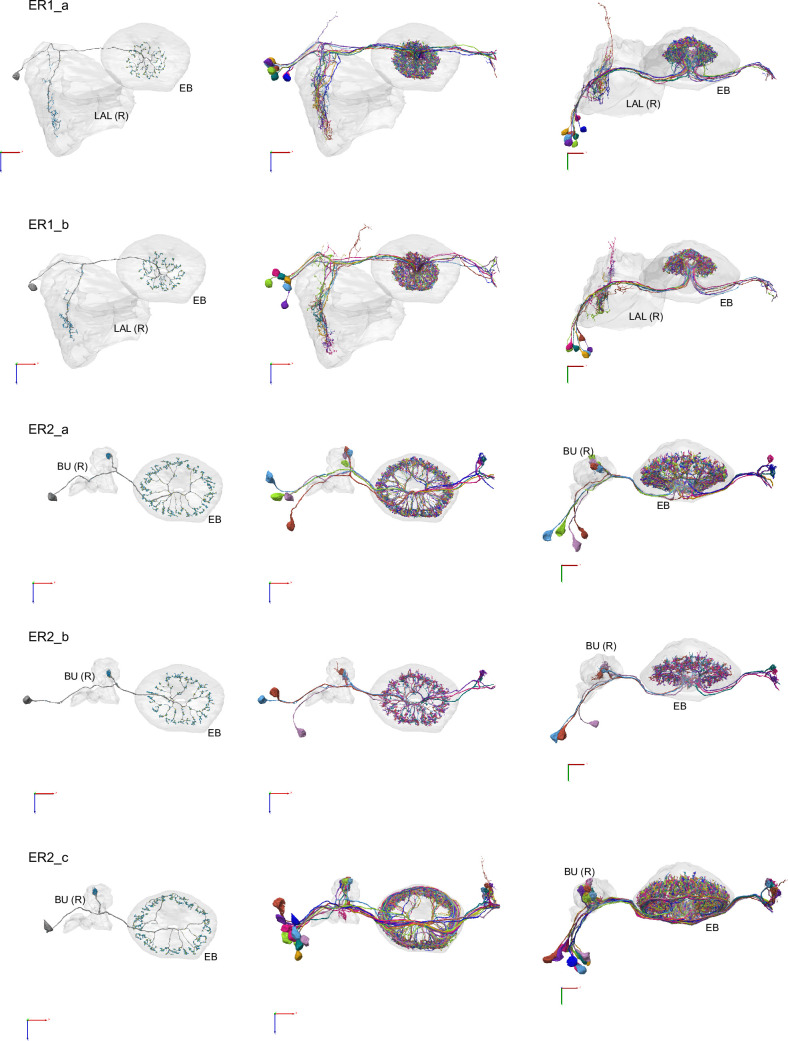
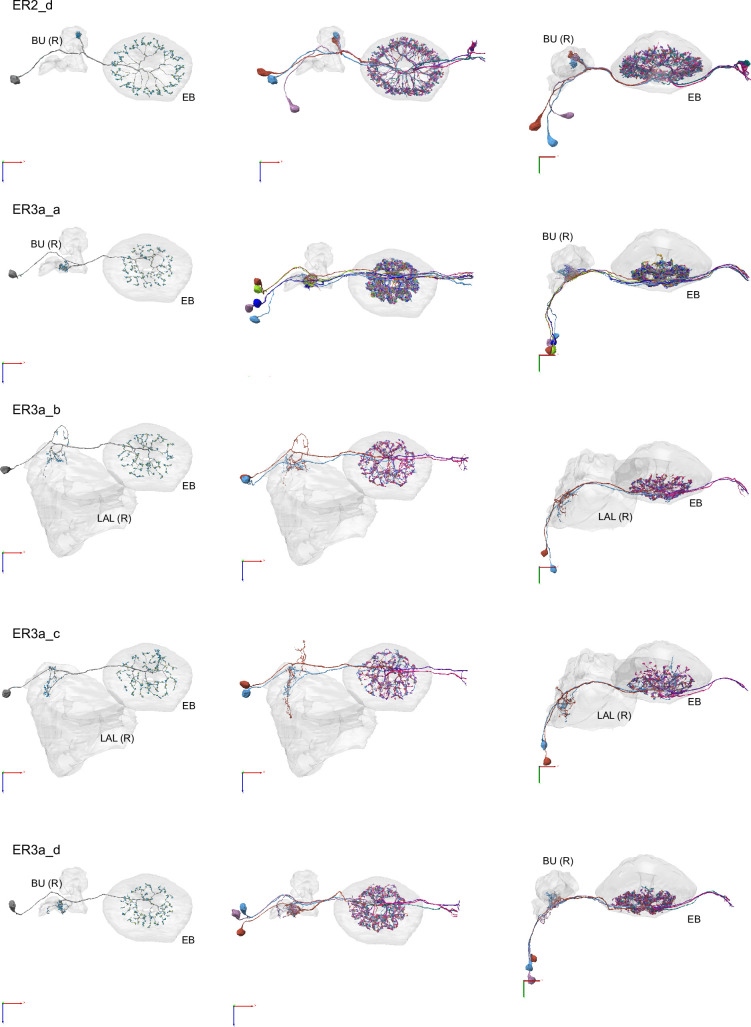
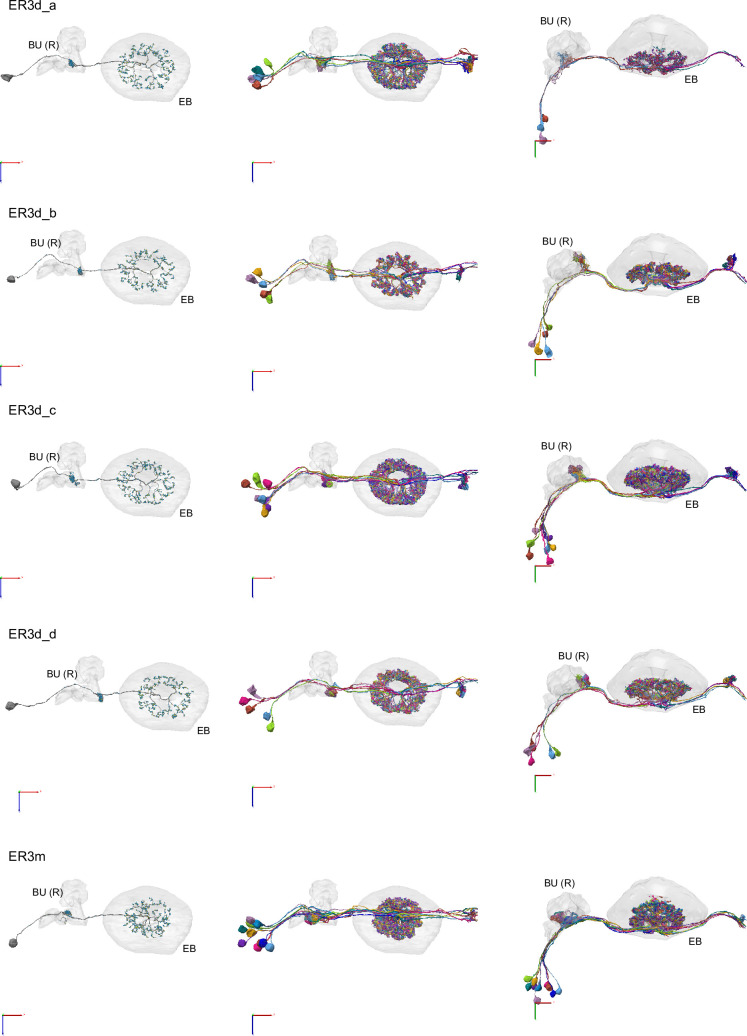
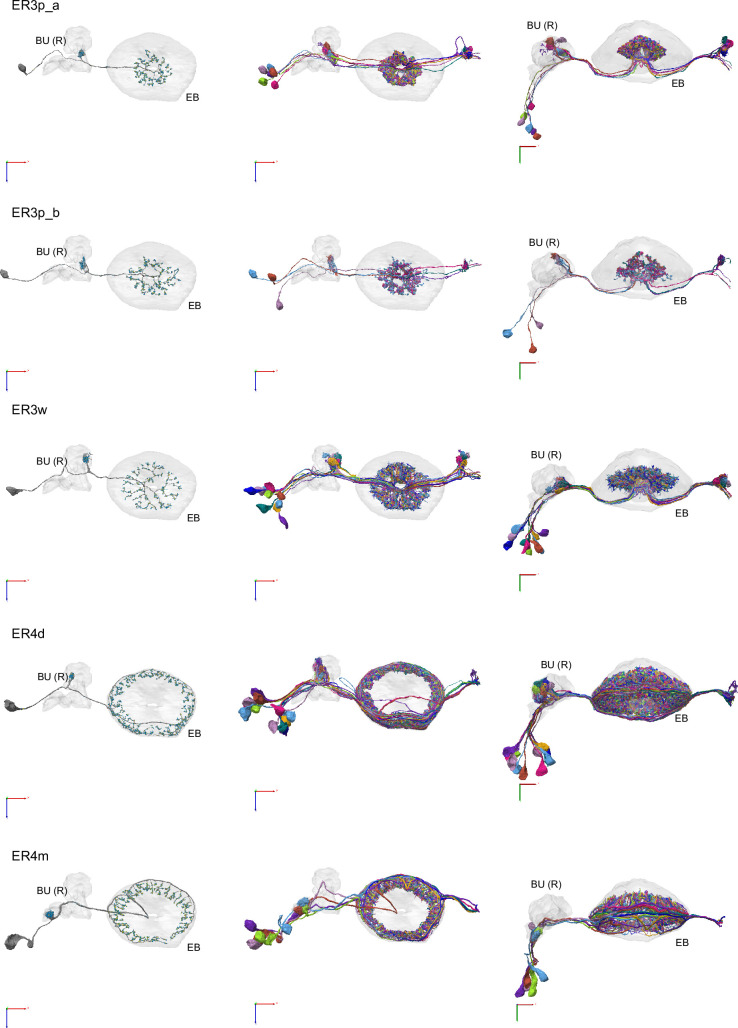
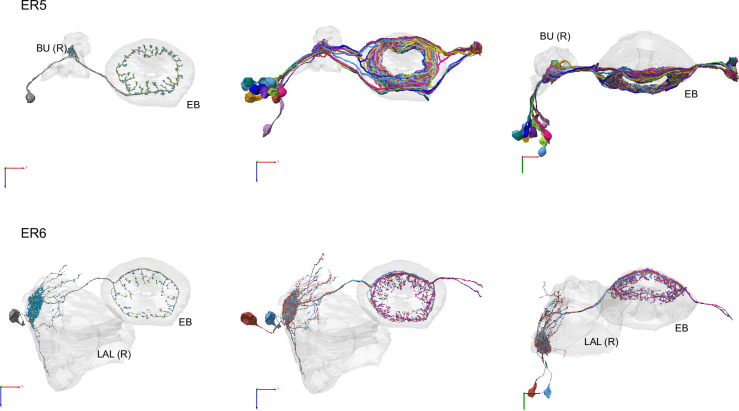
Figure 10. Overview of the organization of the ellipsoid body (EB).
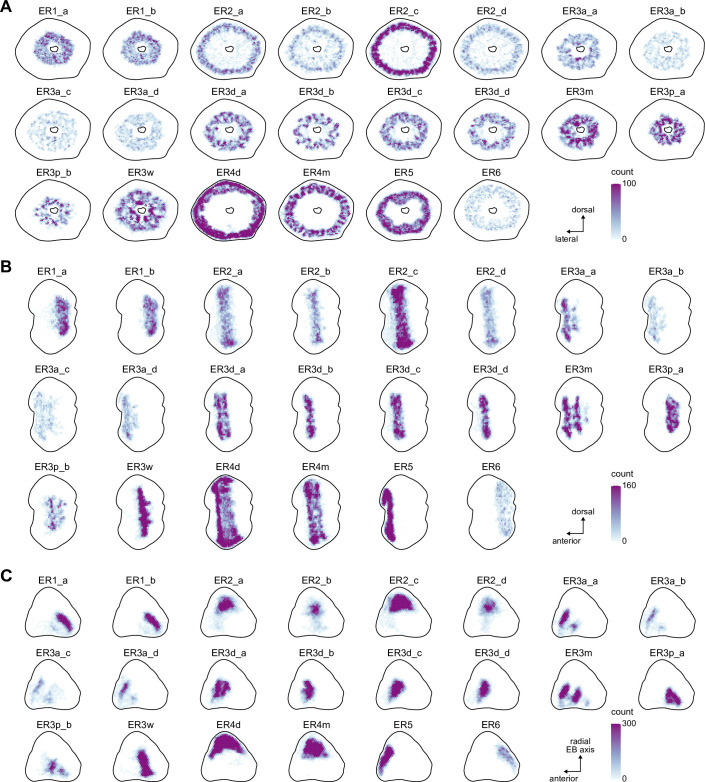
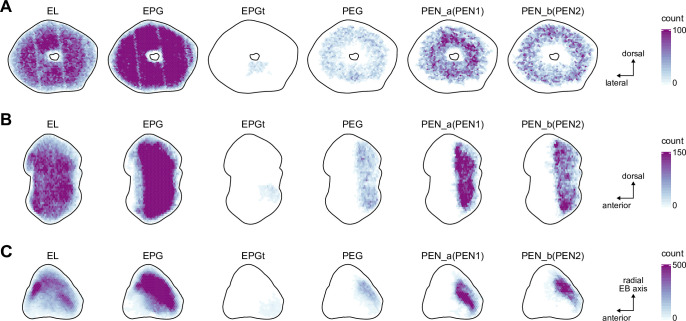
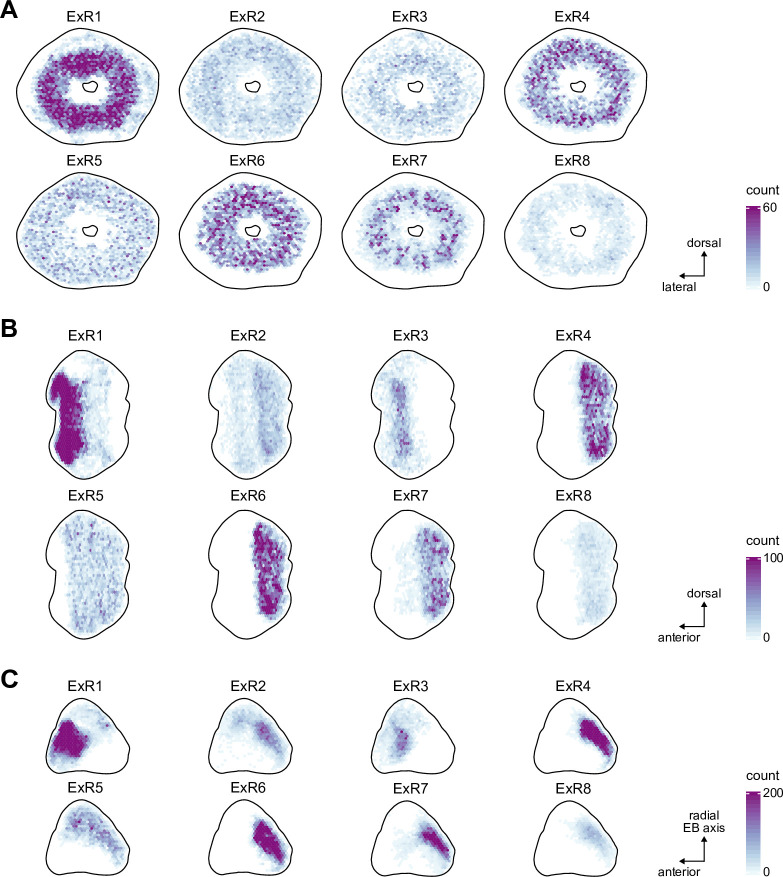
(A) Region arborization plot of neuron types that innervate the EB, showing average pre- and postsynaptic counts by region. For each neuron type, the number of cells from the right hemisphere is noted in the x-axis label. (B) Two-dimensional histograms of synapse counts of ER4m after projection onto the EB cross-sections along the dorsolateral (Bi), dorsoanterior (Bii), and anterior-radial axes (Biii). Note that for (Biii) anterior-radial cross-sections along the circumference of the EB were collapsed onto a single plane. The dashed line in (Bii) indicates one of the cross-sections that were collapsed in (Biii). The shapes of the anterior-radial cross-sections vary along the circumference of the EB, which is shown in Figure 10—figure supplement 4. (C) Normalized synapse densities of ring neurons onto the EB cross-section along the anterior-radial axes (see dashed outline in Bii, solid outline in Biii). (Ci). The synapse densities are color-coded by ring neuron type. (Cii). The synapse densities are color-coded by input regions. The dashed line indicates the outline of the EPG synapse density as seen in (D), for reference. (D) Same as in (Ci), but for columnar EB neurons. (E) Same as in (Ci), but for extrinsic ring (ExR) neurons. (F) Connectivity graph of neurons innervating the EB. Relative weight as measured on a type-to-type level has been mapped to the edge width. Gray shapes indicate groups of neuron types that likely share similar functional tuning based on existing literature. Only connections with a minimal relative weight of 0.05 (5%) are shown. Connections of a type to itself are omitted for simplicity.

