. 2021 Oct 26;10:e66039. doi: 10.7554/eLife.66039

Figure 11. Ring neuron to columnar connectivity.

(A) Neuron-to-neuron connectivity matrix for connections from ring neurons to EL and EPG neurons in the ellipsoid body (EB) on a single neuron level. The boxes on the right side are colored according to the ring neuron’s input region. (B) Morphological renderings of EL neurons and renderings of innervated regions of interest (ROIs). Note that EL neurons target a small region next to the GA, called the gall surround (GAs). (Bi). Single left hemisphere EL neuron with blue dots marking the location of postsynaptic sites and yellow dots those of presynaptic sites. (Bii). Full population of EL neurons. (C) Schematic illustrating variation in synaptic strength in ring neuron to EPG connections due to neural plasticity. Top: connectivity between ring neurons and EPG neurons. Bottom. Illustration of receptive fields (RFs) of single-ring neurons. (D) Connectivity matrix of ER4m inputs to EPG neurons that have been sorted and averaged according to the EB wedge they innervate.

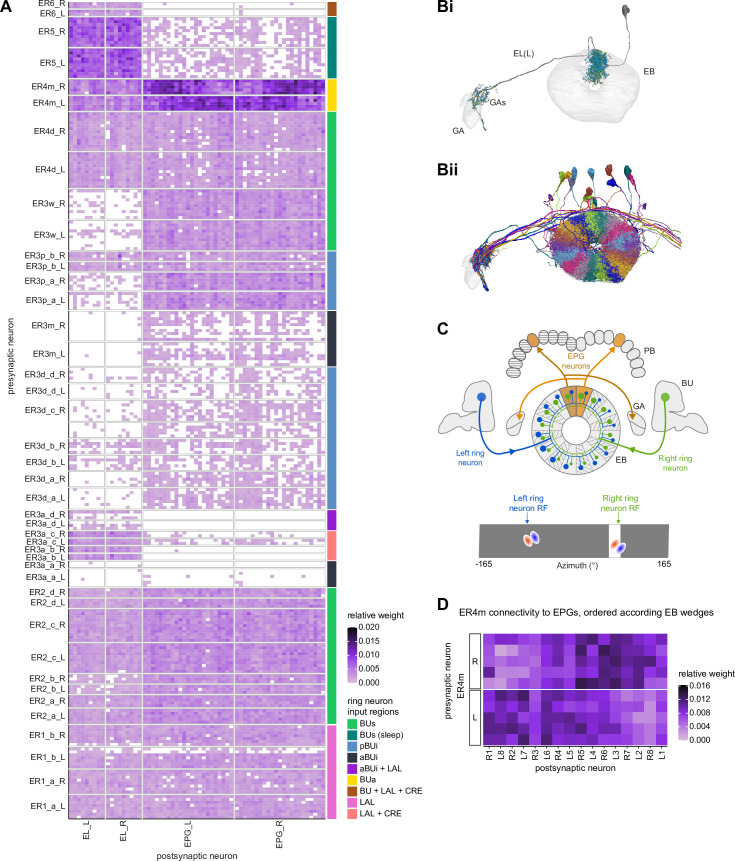
Figure 11.

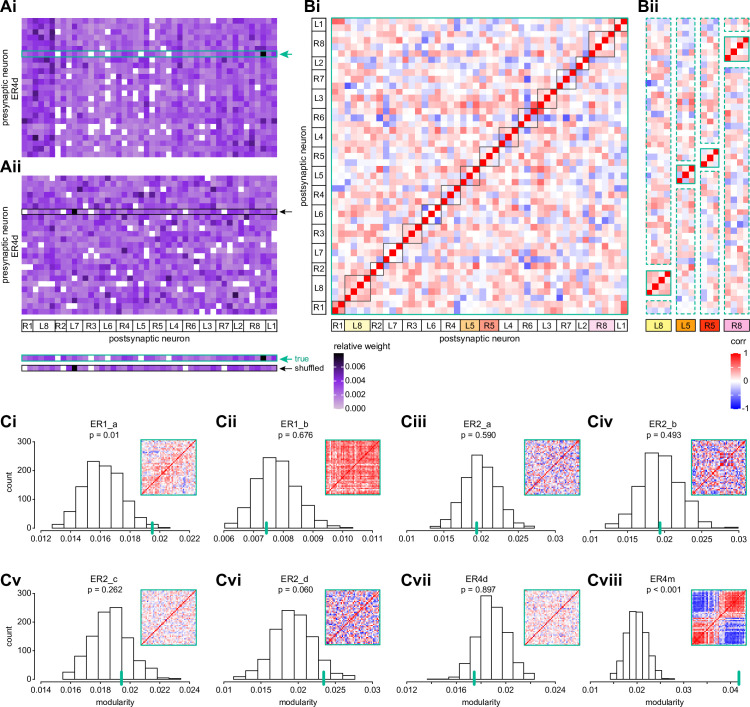
Figure 11—figure supplement 1. Wedge-specific modularity of inputs from ring neurons to EPG neurons.

Figure 11—figure supplement 1.

(A) Neuron-to-neuron connectivity matrix for connections from ER4d neurons to EPG neurons in the ellipsoid body (EB), shown for the matrix that preserves (Ai) versus shuffles (Aii) the individual EPG neurons onto which individual ER4d neurons synapse (highlighted boxes). EPG neurons are ordered according to the EB wedge that they innervate. (B) Pairwise Pearson’s correlation measured between individual EPG neurons according to the pattern of their ER4d neuron inputs. Solid red boxes highlight clusters of EPG neurons that innervate the same EB wedge. Highlighted wedges in (Bi) are shown in (Bii). The modularity of the matrix in (Bi) measures whether individual EPG neurons are more correlated with those EPG neurons within the same wedge (solid boxes in Bi and Bii) than would be expected based on their average correlation with neurons across all wedges (dashed boxes in Bii). (C) Modularity of connectivity from different ring neuron types onto EPGs. Histograms show the distribution of modularity values computed for 1000 shuffled versions of each connectivity matrix (one example of which is shown in Aii). Insets show the correlation matrix of the measured (unshuffled) connectivity matrix; the modularity of this matrix is marked by a green line on the histogram. p-values indicate the fraction of shuffles that produced higher modularity than that of the measured connectivity matrix.