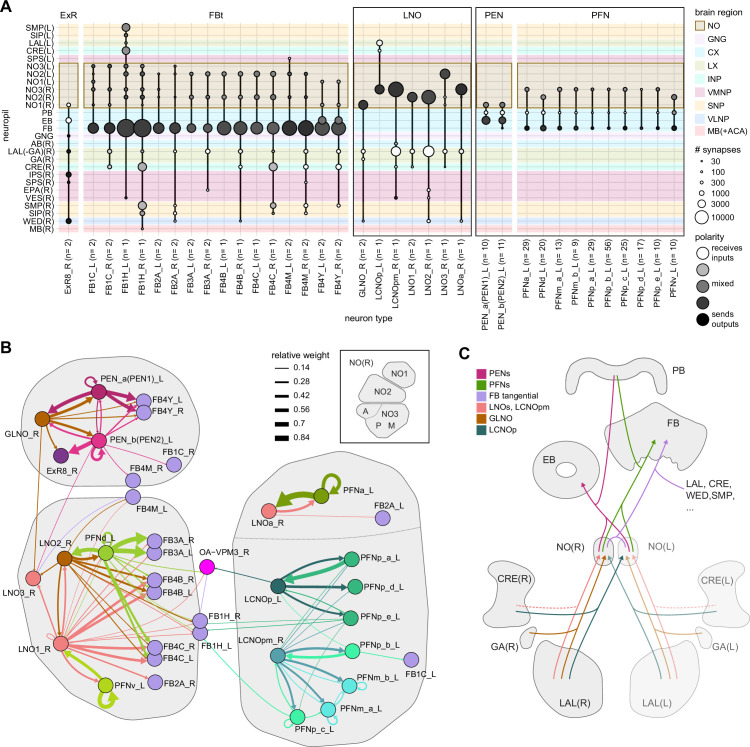
Figure 25. Overview of the noduli and illustration of separate compartments.
(A) Region arborization plot summarizing all cell types that innervate the noduli (NO), showing average pre- and postsynaptic counts by region. Boxes mark groups of neuron types that will be described in more detail in this section. (B) Connectivity graph of all neuron types in the right NO, highlighting clusters that approximately correspond to anatomically defined subcompartments (see inset). The line thickness corresponds to the relative weight of a given type-to-type connection. Only connections with a relative weight of at least 0.05 (5%) are shown. (C) Schematic of how the NO connect to other brain regions.

