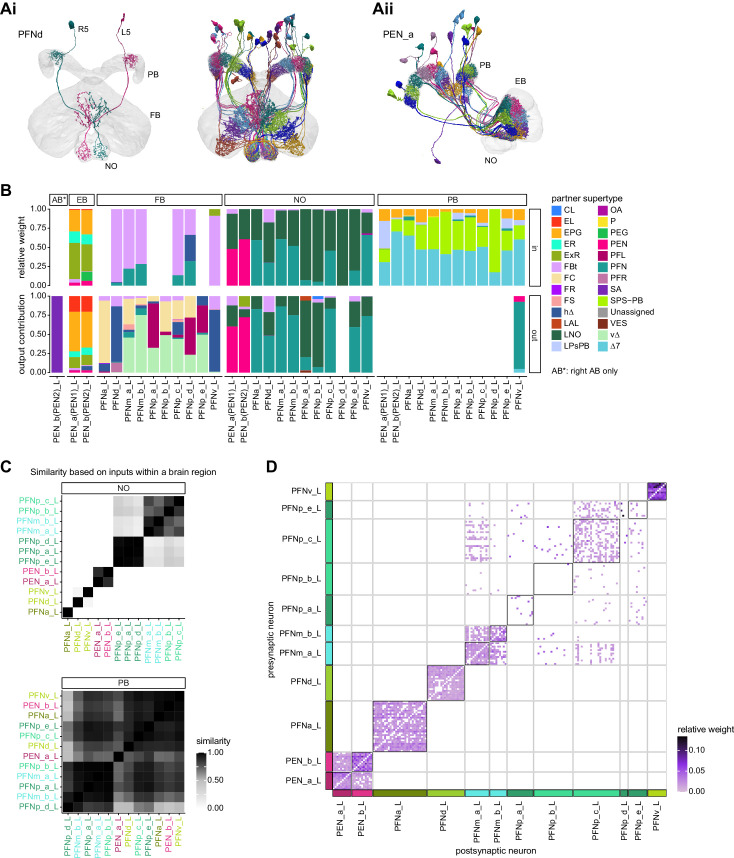
Figure 26. Columnar neurons in the noduli.
(A) Morphological rendering of columnar neurons. (Ai) PFNd neurons. Left: two example neurons from the left and right PFNd population. Right: complete population of PFNd neurons. (Aii) PEN_a neurons. (B) Stacked bar graph illustrating the fraction of inputs and outputs to PFN and PEN partners grouped into supertypes and separated by brain region. Inputs and outputs are normalized per neuron type and brain region. The connectivity strength for inputs and outputs is measured by relative weight and output contribution, respectively. (C) Similarity matrices (see Materials and methods) for columnar noduli (NO) neurons based on their inputs in the NO (top) and protocerebral bridge (PB) (bottom). (D) Neuron-to-neuron connectivity matrix for columnar neurons in the right NO. Connections between neurons of the same type are highlighted with black boxes.


