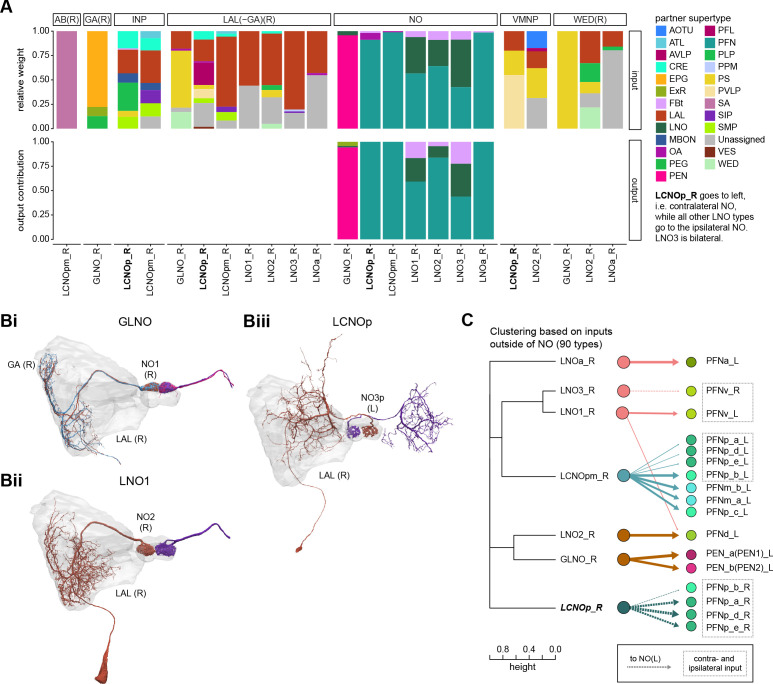
Figure 27. Comparison of LNO neurons, which provide input to columnar neurons.
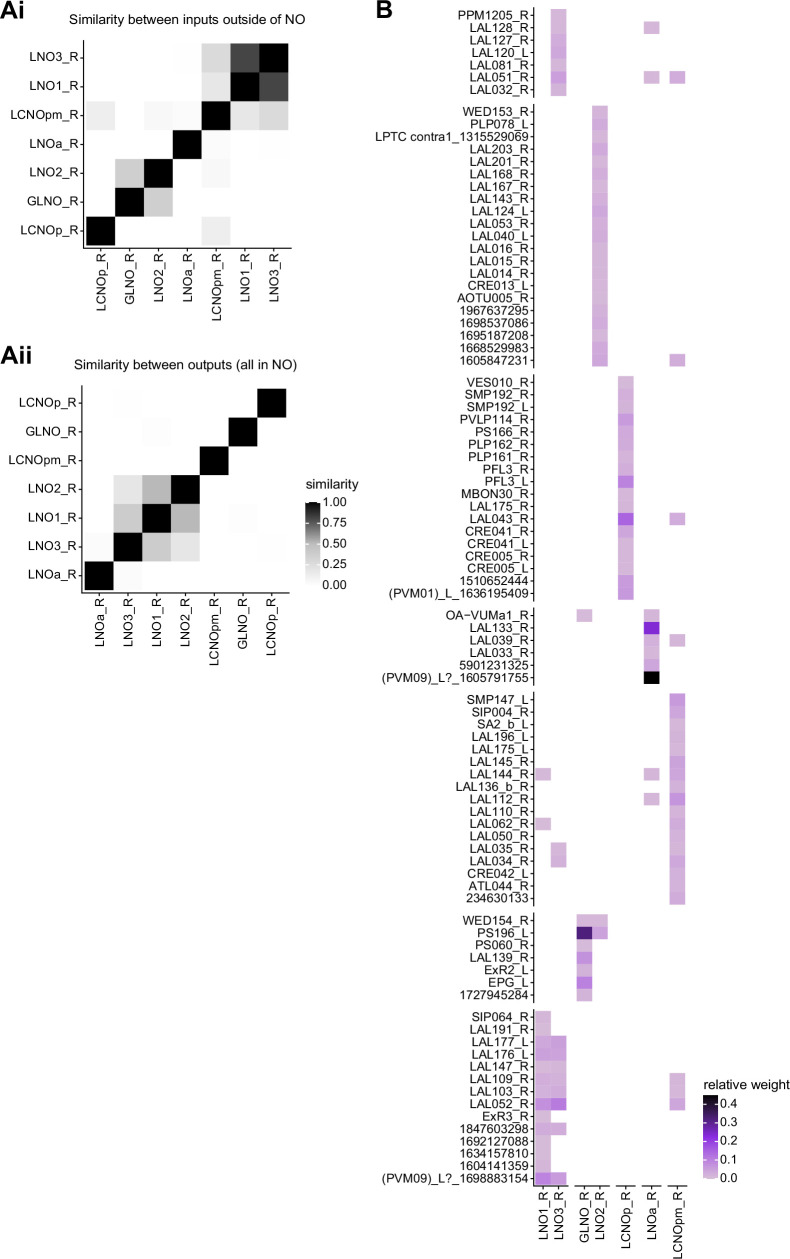
(A) Stacked bar graph illustrating the fraction of inputs and outputs of LNO to partners grouped into supertypes and separated by brain region. Inputs and outputs are normalized per neuron type and brain region. The connectivity strength for inputs and outputs is measured by relative weight and output contribution, respectively. (B) Morphological rendering of LNO neurons. (Bi) GLNO, (Bii) LNO1, and (Biii) LCNOp. Note that LCNOp crosses the midline and arborizes in the contralateral noduli (NO). Additional morphological renderings. LCNOpm, LNO2, LN03, LNa. (C) Illustration of how similarity between LNO neuron types relates to their connectivity to columnar NO neurons. Left: dendrogram depicting the similarity between GLNO, LNO, and LCNO neuron types based on their inputs outside of the NO (i.e., excluding feedback connections from PFN or PEN neurons). The branch height in the dendrogram indicates the normalized distance between types within the similarity space. Right: connectivity from GLNO, LNO, and LCNO neurons onto columnar NO neurons, visualized as in the connectivity graph in Figure 25B. Note that LCNOp and LNO3 neurons project to the ipsilateral NO and therefore target the right-side population of certain PFN types. PFN types that receive inputs from ipsi- and contralateral LNO and LCNO types are highlighted with dashed boxes.


