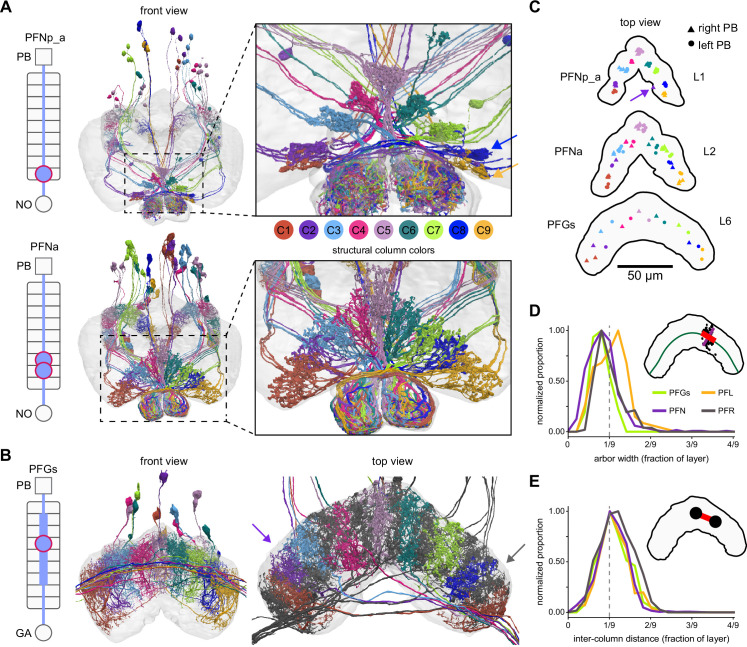
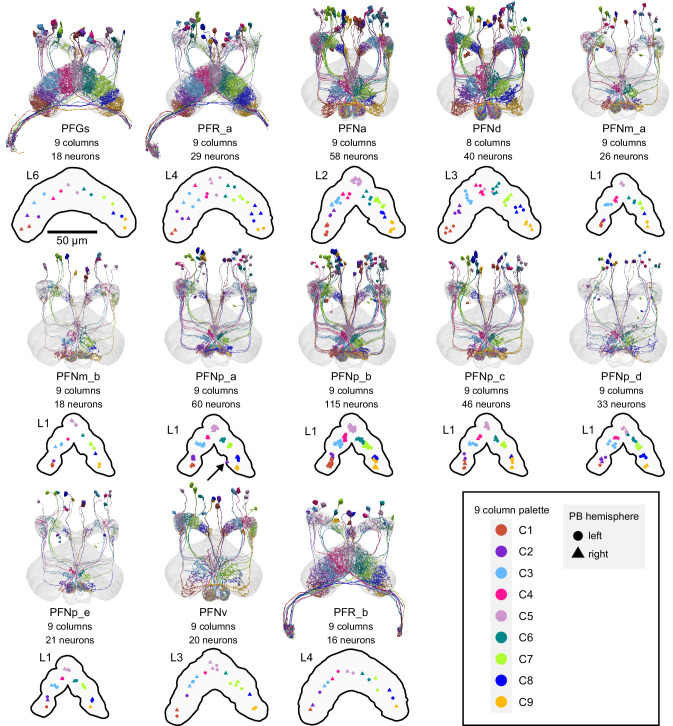
Figure 29. Most PB-FB-* neurons form nine columns in the fan-shaped body (FB).
(A) Morphological renderings of PFNp_a and PFNa populations, colored by column (C1–C9). Left schematic shows location of dendritic (rectangle) and axonal (circles) compartments for the nine FB layers and any associated neuropil. Right panels show zoomed-in views of the FB, revealing a nine-column structure. Notice that PFNp_a columns are clustered while PFNa columns tile the FB more evenly. Note also that neurons innervating the same column often share the same fiber tract. The blue and yellow arrows in the top-right panel mark columns C8 and C9, which are closely spaced but show a clear spatially offset, as shown in panel (C). (B) Morphological rendering of the 18 neurons composing the PFGs population. Schematic on left as described in (A). Left panel shows front view (note that not all cell bodies are visible in this view). Arbor width is variable between cells. In addition, there is more substantial overlap in the dorsal FB arbors. The nine columns defined by this cell type are therefore more distinguishable in the ventral arbors. Right panel grays the nine neurons that project to the right gall, revealing that each column comprises two neurons, one of which projects to the left and the other to the right gall-surround, and that these right- and left-projecting neurons alternate in the FB. This projection pattern breaks the nine columns into ~18 ‘demi-columns,’ one neuron per demi-column, with two exceptions (purple and gray arrows). The purple arrow marks a demi-column which lacks separation from adjacent demi-columns. Similarly, the gray arrow marks a demi-column containing two neurons, whereas all other demi-columns contain one neuron. Whether these are the result of wiring errors requires further investigation. (C) Top-down view showing every neuron’s median location for all individual neurons in the PFNp_a, PFNa, and PFGs populations. Notice that while PFNp_a forms nine clear clusters, PFGs tile space more evenly. The distinct clustering seen in the PFNp_a arbors is reflected by the unique, scalloped morphology of layer 1 of the FB. The arrow in the PFNp_a panel points to a neuron that innervates both C1/C2 (assigned to C2) and C9, which is why its synapse location ended up outside of either cluster. (D) Distribution of neuronal arbor widths for PFGs, PFN, PFL, and PFR neurons. As shown in the inset, the width (red line) of synaptic point clouds (black dots) from individual neurons was measured along a direction locally tangent to a line bisecting the FB layer (green). To account for differences in layer size, the raw width (red line) was normalized by dividing the length of the layer (green line). Each distribution was normalized to have a peak of 1. The vertical dashed line in the graph marks 1/9th of the layer width, the arbor width that would result from nine evenly spaced columns that have minimal overlap and collectively tile the layer. Notice that most neurons take up slightly less than 1/9th of the layer. Importantly, this measure is independent of the neuron’s column assignment. (E) Distribution of inter-column distance, expressed as a fraction of the layer width, as in (D). Inter-column distance was measured by calculating the distance between the mean location of pairs of neurons in adjacent columns (as shown in inset), normalized to the length of the layer.


