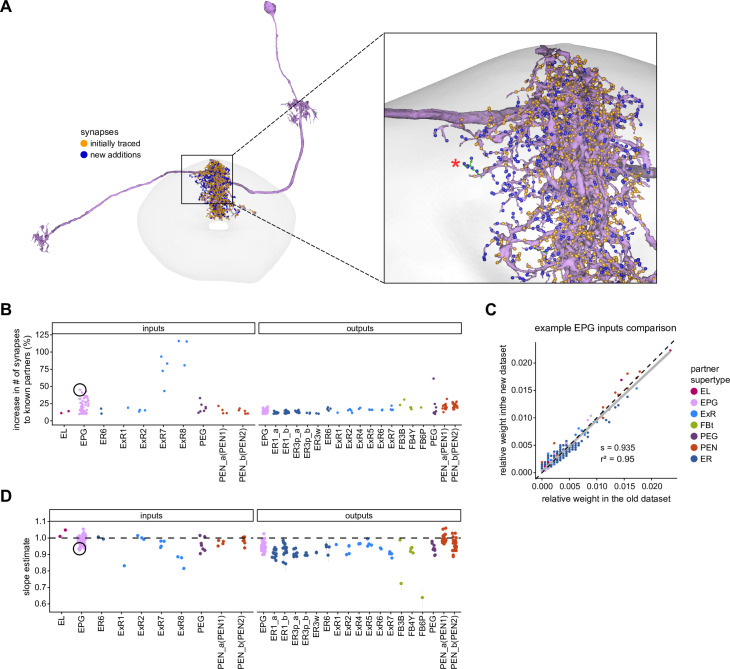
Figure 3. Quantitative impact of different levels of proofreading on neuronal connectivity in the ellipsoid body (EB).
(A) Morphological rendering of an example EPG neuron before and after dense tracing in the EB. Inset, zoomed-in view of part of the EPG arbors highlighting changes resulting from dense reconstruction. The neuron segmentation is in pink. One newly added fragment is colored in green and marked with a red star. Synapses to neurons that were initially identified are in orange. Synapses to neurons that were identified after dense tracing are in blue. These new additions often resulted from joining previously unidentified fragments to their parent neurons, which partner with the example EPG neuron. (B) Change in the number of input synapses from known neurons (left panel) and output synapses to known neurons made with selected EB neurons after dense tracing. Each neuron in this subset had at least 200 presynaptic sites in the EB for the left panel, 200 postsynaptic sites in the EB for the right panel, and at least a 10% change in known synapse numbers after dense tracing. The EB neurons are ordered by type and colored by supertype (see Materials and methods). Each colored dot represents a single neuron of the type indicated. Throughout, we analyze input and output connectivity separately. The example neuron shown in (A) is circled in black. (C) Comparison of the input connectivity of the neuron shown in (A) before and after dense tracing. Each point is the relative weight of a connection between that EPG and a single other neuron. Relative weight refers to the fraction of the inputs that comes from the given partner (see Materials and methods). The color denotes the type of the partner neuron. The gray line is a linear fit with 95% confidence intervals (the confidence interval is too small to be seen). The dashed line is the identity line. (D) Slope of the linear fits (similar to the one in C) with 95% confidence intervals for all neurons considered. Many confidence intervals are too small to be seen. The example shown in (A) is circled in black.


