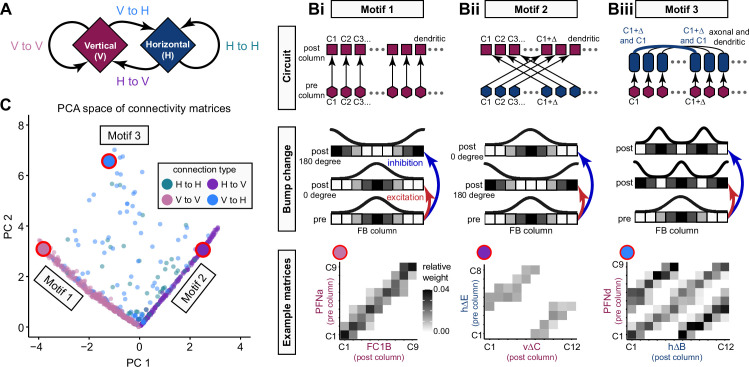
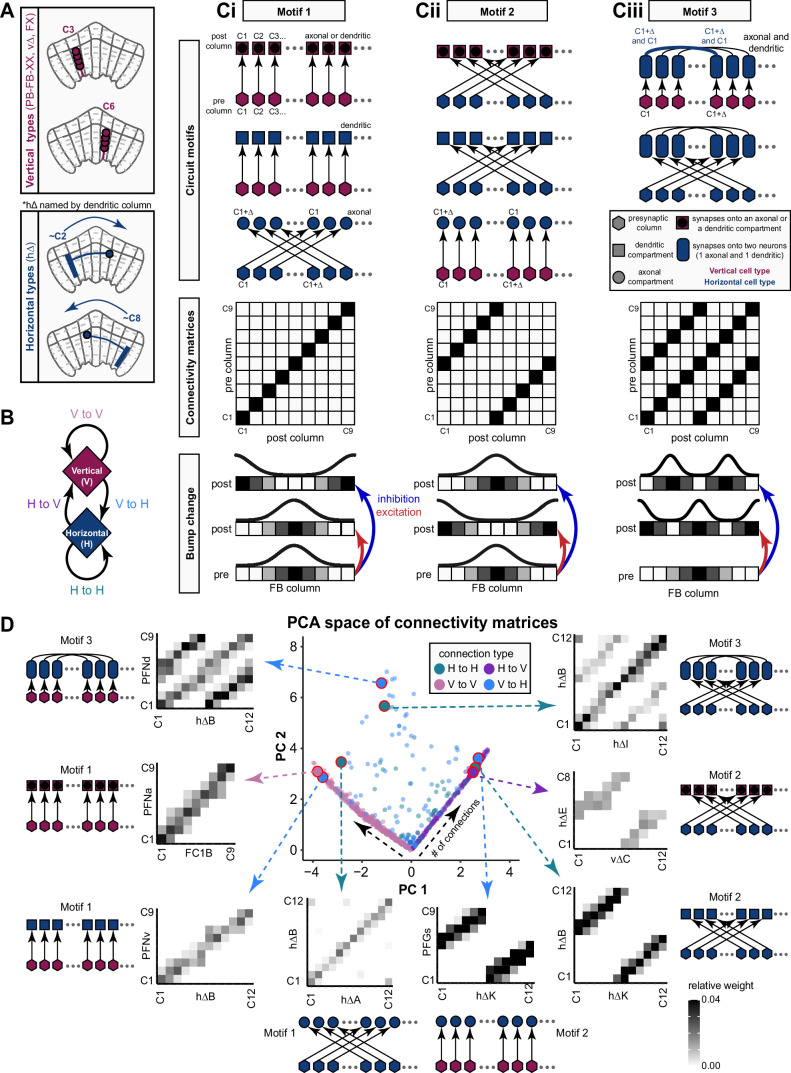
Figure 37. The intra-fan-shaped body (intra-FB) columnar network is built from a small number of circuit motifs.
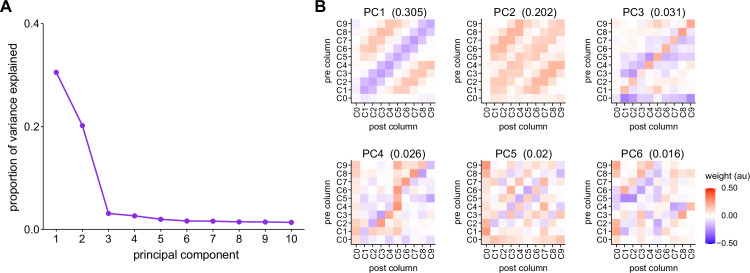
(A) FB columnar neurons can be divided into vertical and horizontal types. Throughout the figure, vertical types are marked in maroon and horizontal types are marked in dark blue. Note that hΔ neurons are named according to the column containing their dendritic arbor, which impacts the connectivity matrix structure, as shown in the examples in (B). Vertical and horizontal neurons give rise to four connection types. vertical-to-vertical (V to V), vertical-to-horizontal (V to H), horizontal-to-horizontal (H to H), and horizontal-to-vertical (H to V). (B) Three columnar-to-columnar connectivity motifs generated by three circuit motifs. Top panels show circuit motifs that generate the corresponding column-to-column connectivity matrix shown in the bottom panels. The middle panels show how excitatory or inhibitory connections would impact bump phase. In each circuit diagram, all presynaptic columns are marked with hexagons, while postsynaptic columns can be dendritic (squares), axonal (circles), or contain multiple hΔ neurons with either dendritic or axonal arbors (rounded rectangles). See legend in Figure 37—figure supplement 1 for details. Circuit motifs are shown with ellipsis (…) to indicate variable column numbers, while connectivity matrices and bump change diagrams are shown with the nine-column pattern typical of most FB columnar neurons. (Bi) Motifs that generate a diagonal column-to-column connectivity matrix. Excitatory connections could pass the bump to a second layer while maintaining its phase, while inhibitory connections could shift the bump’s position by 180°. (Bii) Motifs that generate a shifted column-to-column connectivity matrix. Excitatory connections would shift the bump by 180° while inhibitory connections would maintain its phase (bottom panel). (Biii) Motifs that could produce a column-to-column connectivity matrix with two diagonal bands. Excitation and inhibition could produce a double-bump pattern, as shown in the bottom panel. Alternatively, if the axonal compartment receives inhibitory input and the dendritic compartment receives excitatory input, a single bump would be preserved (not shown). (C) Scatter plot showing that FB connectivity matrices can be grouped into one of the three motifs. Each circle in the scatter plot marks the location of a single connectivity matrix in principal component space. Briefly, each column-to-column connectivity matrix was coerced into a nine-column scheme, binarized, and transformed into a vector. Principal component analysis (PCA) was performed using a matrix containing all connectivity vectors (n = 903 connectivity matrices), and each vector was projected onto the largest two PCs (PC1 and PC2). Circles are colored according to pre-to-post connection type (see legend). Note that the large majority of connectivity matrices correspond to motifs 1 and 2 (diagonal point clouds), whose orthogonality is preserved in PC space. Points lying off these diagonals largely correspond to motif 3. The three large circles outlined in red correspond to the connectivity matrices in the bottom panels of (B).


