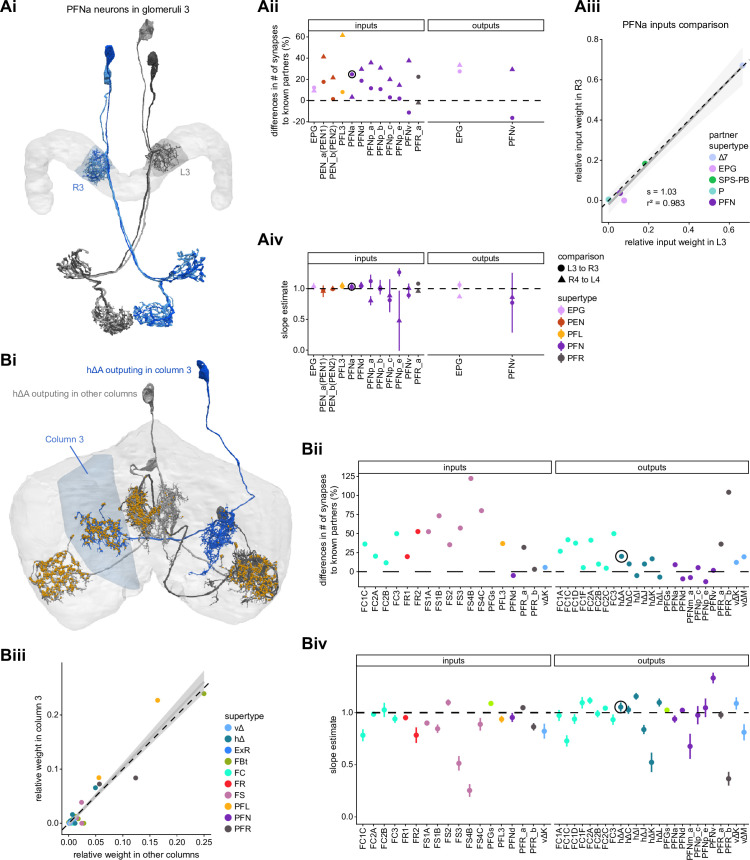
Figure 4. Differences in connectivity between compartments at different levels of tracing.
(A) Differences in connectivity between mirror-symmetric protocerebral bridge (PB) glomeruli. We compare glomeruli that are densely proofread (L4/R3) or not (R4/L3). R or L refer to the right or left half of the PB, respectively. Each half of the PB is made up of nine distinct glomeruli, with glomerulus 1 the most medial and glomerulus 9 the most lateral. (Ai) Sample PFNa neurons that each arborize in a single PB glomerulus. Two arborize in L3, and the other two in its mirror symmetric glomerulus, the densely proofread PB glomerulus R3. (Aii) Percentage increase in input connectivity (left) and output connectivity (right) to known partners for neuron types innervating single glomeruli between R4 and L4 or L3 and R3. Types were selected if they had neuron instances that innervate all four of these glomeruli, with each instance having at least an average of 20 synapses per glomerulus and at least 80% of their PB synapses in the given glomerulus. For a given type, circles denote the L3-to-R3 comparison and triangles the R4-to-L4 comparison. Few output comparisons can be made because most columnar neurons mainly receive input in the PB. (Aiii) Comparison of input connectivity for the type shown in (Ai) in R3 and L3. Each point is the relative weight of a connection between that type and another neuron type. The color denotes the supertype of the partner. The gray line is a linear fit with 95% confidence intervals. The dashed line is the identity line. (Aiv) Slope of the linear fit (similar to the one in Aiii) with 95% confidence intervals for all types considered. (B) Differences in connectivity between a densely proofread section of the FB (denoted as ‘column 3’, or C3) and other parts of the FB. (Bi) Sample hΔA neurons. One (in blue) has almost all of its output synapses in C3. The other four avoid C3 altogether. Output synapses are in orange. (Bii) Comparison of the average number of synapses to known partners per type between neuron instances innervating the heavily traced C3 and instances innervating other columns. Types are selected as having instances innervating C3 with at least an average of 200 synapses of a given polarity in the fan-shaped body (FB) and having at least 80% of those synapses in C3. They are compared to neurons of the same type with no synapses in C3 (e.g., the hΔA neurons in gray in Bi, circled in black). Plotted are the percentage increases in input connectivity (left) or output connectivity (right) to known partners for neurons in FB C3 versus other columns, by type. (Biii) Comparison of output connectivity for the type shown in (Bi) between neuron instances innervating C3 and instances avoiding C3. Each point is the average relative weight of a connection between that type and another neuron type. The color denotes the supertype of the partner type. The gray line is a linear fit with 95% confidence intervals, the dashed line is the identity line. (Biv) Slope of the linear fit (similar to the one in Biii) with 95% confidence intervals for the types considered. hΔA neurons are circled in black.


