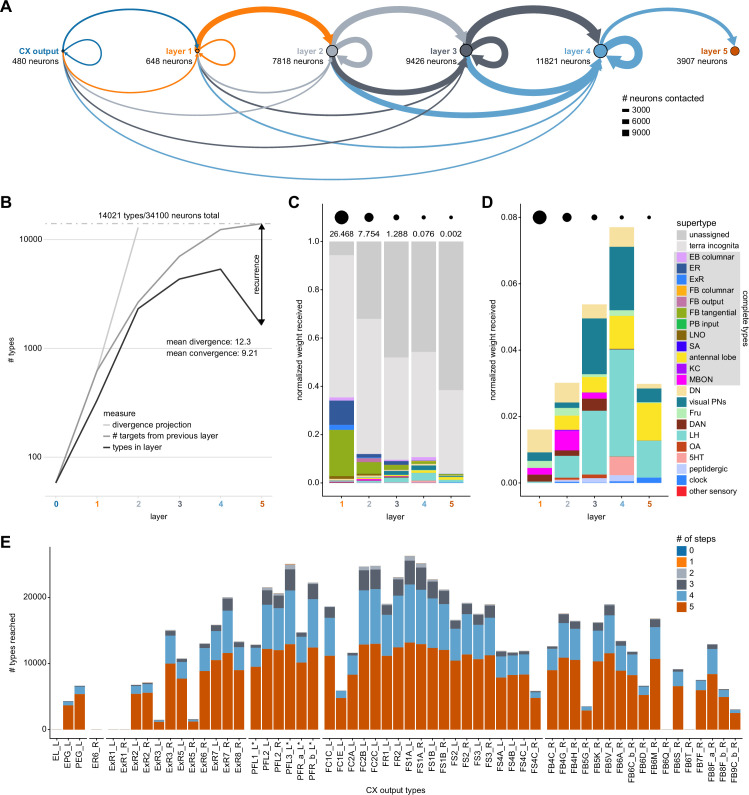
Figure 55. Divergence of output networks.
(A) Diagram of the number of neurons contacted while walking five steps downstream from central complex (CX) neurons that arborize outside the CX. Size of the circles represents the number of new neurons in each layer. The layer a neuron is assigned to corresponds to the length of the shortest path from the CX to that neuron. The thickness of the connecting lines indicates the number of neurons reached in the same layer (loops), in the next layer (top arc) or in previous layers (bottom arcs). Color of the connector indicates the layer of origin. (B) The number of types per layer (black), the total number of targets of the previous layer to any layer (dark gray), and the projected number of types from the mean divergence of the previous layer (light gray). The difference between the total number of targets (dark gray) and the number extrapolated from the divergence (light gray) reveals the level of convergence of the output pathways. The difference between the number of types per layer (black) and the total number of targets (dark gray) corresponds to connections that are not simple feedforward connections and reveals the amount of recurrence of the output pathways. On average, each type connects 12.3 other types (divergence of 12.3) and is contacted by 9.21 other types (convergence of 9.21). Note that the total here exceeds the number of neurons in the database as they include simulated pathways on the side of the brain not present in the volume (see Materials and methods). Of the 34,100 neurons reached, 21,363 (out of 26,190 for the entire dataset) are in the hemibrain dataset, and 12,737 are mirror symmetric neurons from existing neurons inferred from symmetric connections. (C) Relative type composition of the different layers weighted by the pathway weight (see Materials and methods, Appendix 1—figure 3) they receive from the CX. Circles on the top row represent the total pathway weight received in every layer. The total pathway weight decreases as the layer gets farther away from the CX, as is expected with the metric used, which multiplies relative weights across a pathway then sums pathways ending on the same neuron. Reflecting the composition of the database, the majority of neurons reached either belong to poorly studied neuropils (‘terra incognita’) or have no name in the database (‘unidentified’). Note that in the first layer, most identified targets are CX types. (D) Same as (C), but zoomed-in onto known types excluding CX types. Types with a gray background in the legend are those for which most existing neurons of that type are present in the database. The fraction of known targets increases to reach a maximum in the fourth layer. (E) Number of types reached outside of the CX for every CX neuron innervating outside of the CX in different downstream layers. Note that very small numbers are not visible on this scale.

