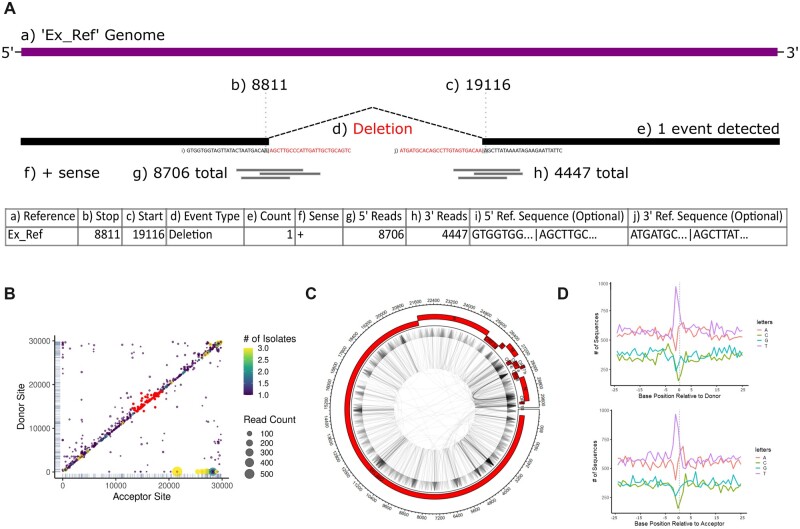
Fig. 1.
Example input data and plot outputs from ViReMaShiny using sample SARS-CoV-2 data from a previous study (Jaworski et al., 2021). (A) A table with an example recombination event in ViReMa output BED format. Subsection (a) refers to the reference sequence of the event; (b, c) indicate the nucleotide base positions spanning the event; (d) is the type of recombination event; (e) is the number of reads detected with this event; (f) is the sense or strandedness of the nucleic acid the event was detected on; (g, h) correspond to the number of reads spanning (b) and (c), respectively; (i, j) are reference-derived nucleotide sequences at the recombination junction, 25 bp upstream and downstream of both (b) and (c). (B) A scatterplot depicting recombination events by donor and acceptor site indexes. Read counts correspond to dot size while color encodes the number of isolates the event appears in. A subset of interest is highlighted in red. (C) An example Circos plot depicting all recombination events. The plot includes annotations for the NCBI RefSeq NC_045512.2 SARS-CoV-2 genome. (D) Nucleotide bias at donor (top) and acceptor sites (bottom) for all recombination events. Donor and acceptor sites correspond to (b) and (c) in (A), respectively (A color version of this figure appears in the online version of this article.)

