
Fig. 2.
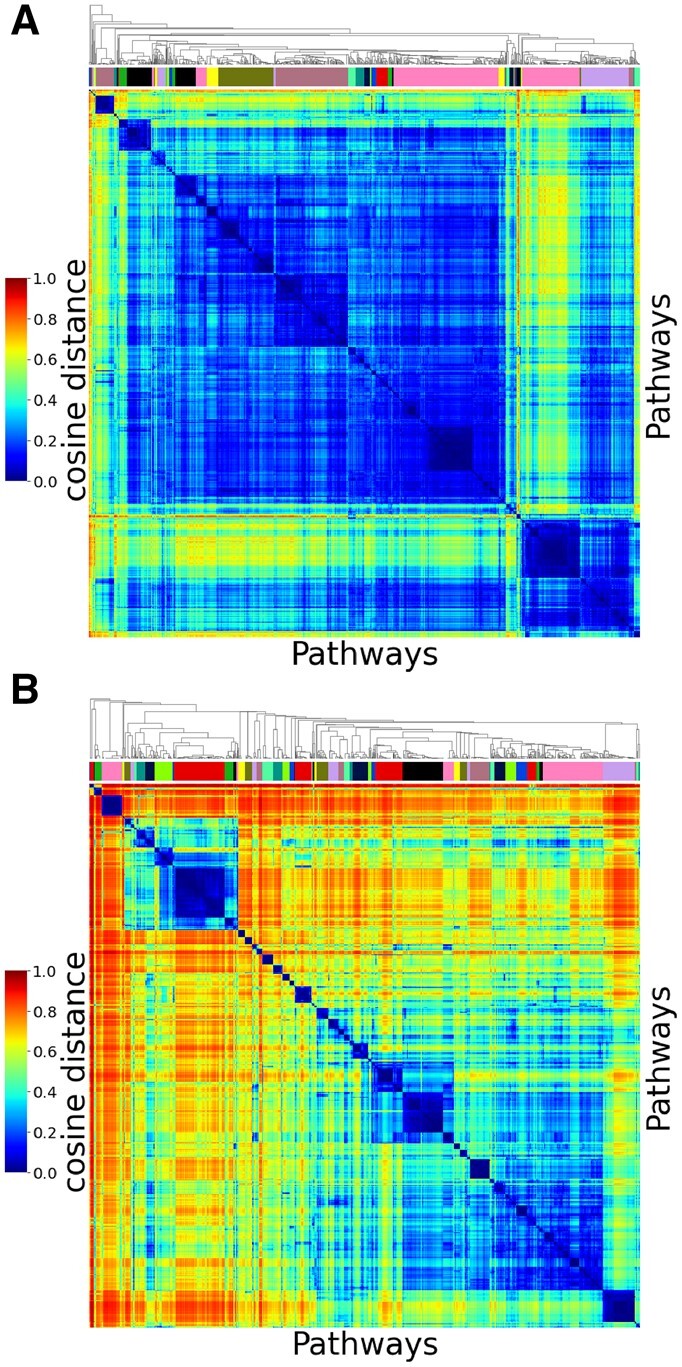
PNMTF best captures the functional organization of pathways in the healthy lung cell. (A) and (B) show a clustered heat map of the pairwise cosine distances between all pathway embeddings in the shared space V learned based on graphlet adjacency by GNMTF and PNMTF, respectively. For each heat map, the color bar under the hierarchical tree on the top indicates the 65 pathway clusters