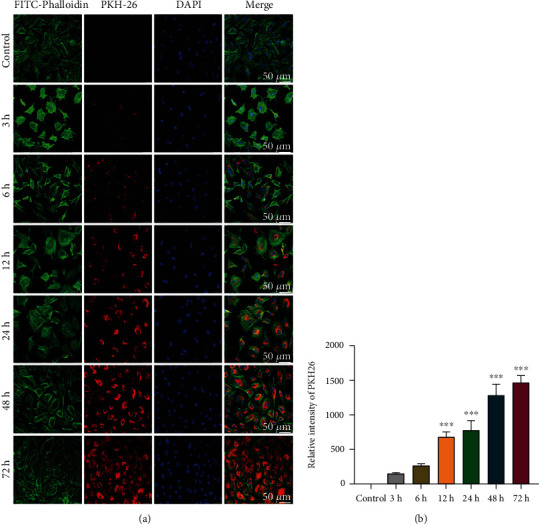
Figure 4.

The time course effect of hBMSC-EXO internalization in chondrocytes. (a) EXO internalization was gradually increased along with the time elongation. hBMSC-EXOs were labeled with PKH26 (red) and incubated with primary rabbit chondrocytes at the dosage of 1 × 10⁹/ml. Immunofluorescence staining was performed at different time points as indicated. FITC-Phalloidin (green) and DAPI (blue) were used to label the cytoskeleton and the nucleus, respectively. Scale bar = 50 μm. (b) The fluorescence intensity for PKH26. n = 3. Values are presented as mean ± SEM. ∗∗∗P < 0.001, versus the control group, one-way ANOVA.
