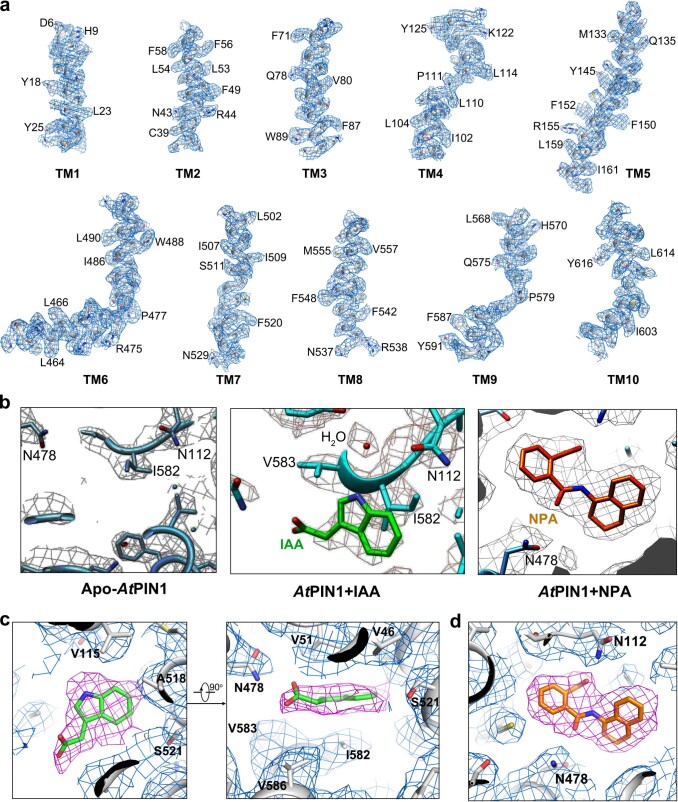
Extended Data Fig. 4. Representative EM densities for the PIN1 maps.
a, EM densities for the ten transmembrane helices of the apo PIN1 map. Residues with notable side chains are labeled aside. b, EM densities for the ligand binding pocket in the apo PIN1 map (left), the IAA-bound map (middle), and the NPA-bound map (right). A clear density is identified in the EM map of the PIN1 plus IAA, or NPA sample, which is docked as an IAA or NPA molecule, respectively. A density modelled as water is also observed between IAA and the N112 residue. c, Zoom-in views of the EM density for IAA. d, A zoom-in view of the EM density for NPA.

