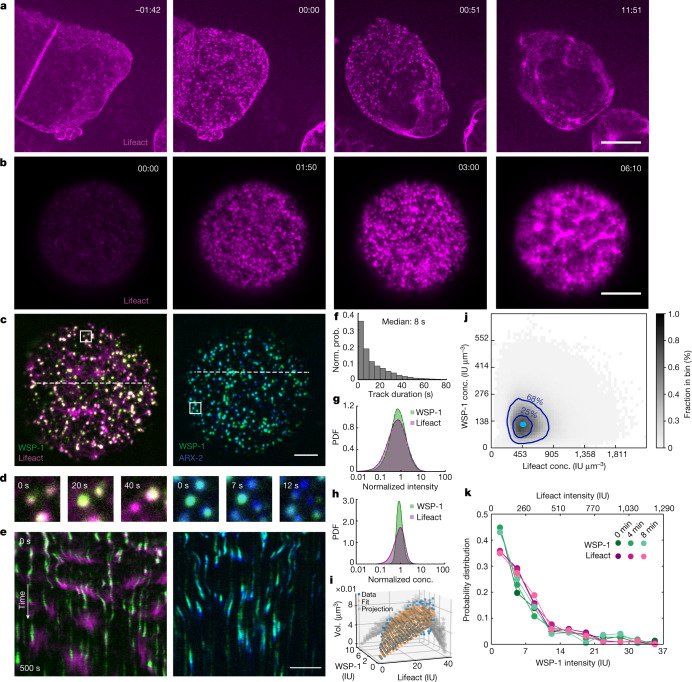
Fig. 1. Actomyosin cortex formation at the oocyte-to-embryo transition proceeds through dynamic F-actin/WSP-1 cortical condensates.
a, In utero microscopy images of the oocyte-to-embryonic transition in C. elegans at different times with respect to fertilization (min:s). F-actin (Lifeact::mKate) in magenta; scale bars, 10 μm (a,b,c,e). b, TIRF images of an isolated oocyte undergoing maturation. In both examples (a and b), a contractile cortex forms (rightmost image) following a stage characterized by the emergence of short-lived dynamic condensates rich in F-actin (two middle images). c, TIRF images of cortical condensates. Endogenous WSP-1::GFP in green (left) and endogenous ARX-2::mCherry in blue (right). d, Compositional dynamics of condensates located within the respective white boxes in c over time, revealing that adjacent condensates can differ in their instantaneous dynamics. e, Condensate dynamics as revealed by kymographs obtained from the white dotted lines in c. f, Normalized probability (Norm. prob.) of condensate lifetime duration. g,h, Probability density functions (PDF) of Lifeact::mKate (magenta) and WSP-1::GFP (green) intensities (g) and concentrations (conc.) (h) within condensates. i, Condensate volumes (Vol.) measured (blue) based on the assumption that cortical condensates have a spherical shape and calculated (orange) from the volume dependence on molecular content . j, Instantaneous concentrations of F-actin and WSP-1 within condensates from an ensemble of 36,930 condensates from 9 oocytes. Here 68% and 25% of instantaneous condensate concentrations fall within the outer and inner dark blue contour line, respectively. The light blue dot indicates the peak of preferentially maintained concentration pair of WSP-1 and F-actin in control oocytes. k, Normalized probability density functions of WSP-1::GFP (green lines) and Lifeact::mKate (magenta lines); the integrated condensate intensities are similar at 0, 4 and 8 min after the onset of oocyte maturation.

