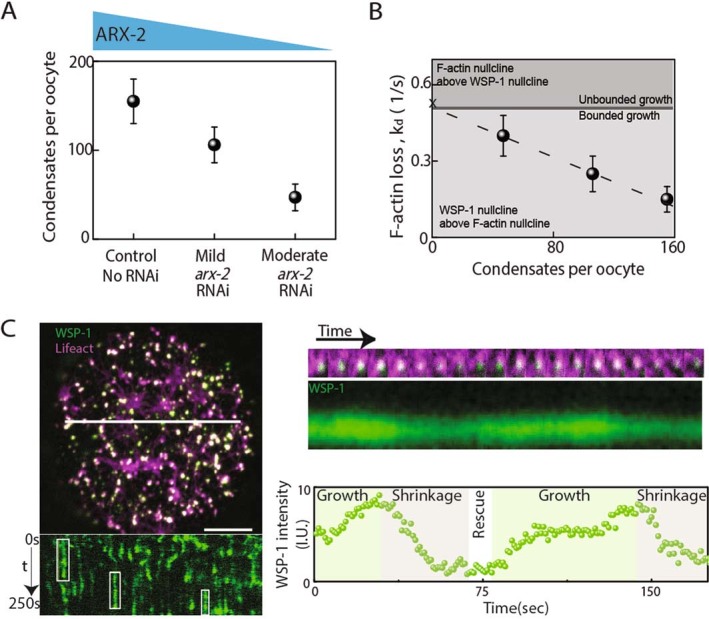
Extended Data Fig. 7. Transition to unbounded growth, and rescue events.

A, The steady state number of condensates per oocyte in non-RNAi control oocytes and in oocytes subjected to 18-20hrs of arx-2 RNAi was used to classify RNAi phenotype severity - mild (between 30 and 70 cortical condensates per oocyte) and moderate (between 70 and 120 cortical condensates per oocyte) arx-2 RNAi. B, Non-RNAi control, mild and moderate arx-2 RNAi conditions as described in A showed a systematic increase in kd with a decrease of the number of cortical condensates per oocyte. In A, B the control, mild and moderate datasets comprised n = 9, n = 7 and n = 7 oocytes respectively while the error bars correspond to standard errors of mean (A) and the margin of error of a 95% confidence interval (B) respectively. Severe arx-2 RNAi leads to a loss of dynamic cortical condensates (with zero condensates per oocytes) and the emergence of large persistent patches of WSP-1 and F-actin, in agreement with unbounded growth (Fig. 3b, right). Hence, we expect the value of kd at zero cortical condensates per oocyte to coincide with the critical value of kd at which condensate dynamics become unbounded. A linear fit (dashed line) provides an extrapolated estimate of the y-intercept value of kd = 0.49 ± 0.04. Note that this value is similar to the critical value of kd ≈ 0.47 at which the nullclines switch position (with the three other growth coefficients determined from moderate arx-2 RNAi), with the A-nullcline now above the W-nullcline (see Fig. 3c, right; compare to left, middle). In the graph above, the x on the y-axis marks the value of kd = 0.51 used for calculating the phase portrait for severe arx-2 RNAi (Fig. 3c, right), which is in the unbounded growth regime. C, Left, rescue events in the representative image shown in Fig. 1c. Top, snapshot; bottom, kymograph along white line showing rescue events (indicated by green boxes). Right, one representative rescue event of a cortical condensate showing two cycles of growth and shrinkage, separated by rescue. Top, time-series; middle, kymograph; bottom, integrated WSP-1 intensity. Scale bar, 10μm.
