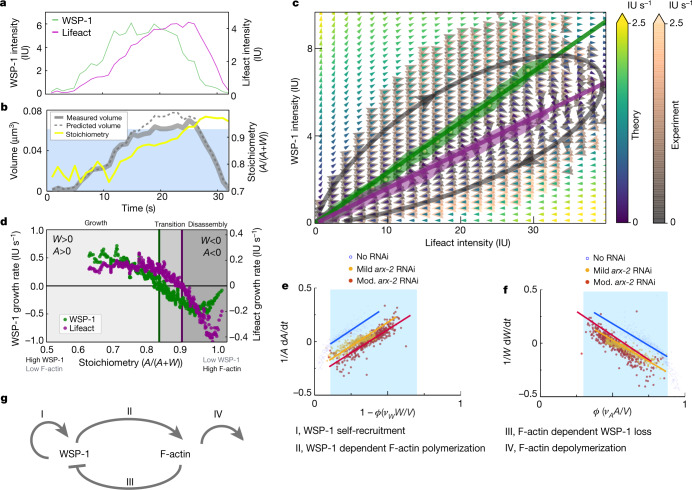
Fig. 2. Mass flux phase portrait analysis of cortical condensate growth laws.
a, Time traces of WSP-1::GFP (green line) and Lifeact::mKate (magenta line) total condensate intensities from a representative cortical condensate. b, Time traces of the measured (solid grey line) and determined (dashed grey line) volume using the volume dependence on molecular content , and stoichiometry (yellow line) for the cortical condensate in a. The blue shaded region indicates the range of stoichiometry for which the volume dependence accounts for measured volumes (Extended Data Fig. 2). c, Mass flux phase portrait measured from 299,165 time points of 36,930 condensates from 9 oocytes (experiment, orange and grey arrows), and calculated from empirically determined growth laws (theory, yellow, green and blue arrows); see Extended Data Fig. 10 for separate representations. The colour scale denotes time rate change vector magnitudes. Thick lines indicate WSP-1 (green) and F-actin (magenta) nullclines from experiment; thin lines indicate theoretical nullclines. Absolute molecular amounts can be estimated for WSP-1 with 8 IU corresponding to approximately 100 WSP-1 molecules. d, Measured WSP-1 (green) and F-actin (magenta) growth rates as a function of stoichiometry display three regimes separated by the WSP-1 nullcline at stoichiometry approximately 0.85 and the F-actin nullcline at stoichiometry approximately 0.9. e,f, Linear dependence of relative WSP-1 (e) and F-actin (f) growth rates—in the unperturbed control (blue) and mild arx-2 RNAi (orange) and moderate (mod.) RNAi (red) cases—on effective F-actin volume fraction ϕ (Supplementary Information). Linearity holds within the blue shaded region (see b, Extended Data Fig. 2) and is indicated with lines, yielding the parameters kr, kl (e) and kb, kd (f). g, Reaction motif underlying the structure of c–f composed of WSP-1 self-recruitment, WSP-1 dependent F-actin polymerization, F-actin dependent WSP-1 loss and F-actin depolymerization.

