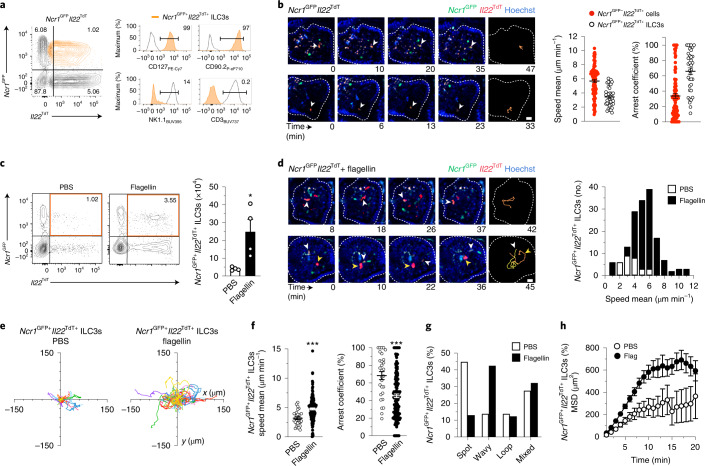
Fig. 2. Monitoring of intestinal tissue during inflammation by patrolling ILC3s .
a, Representative flow cytometry analysis for the identification of Ncr1GFP+Il22TdT+ ILC3s in intestinal CD45+ cells from Ncr1GFPIl22TdT reporter mice. Data are representative of three independent experiments. b, Time-lapse images (scale bar, 15 µm) of Ncr1GFP+Il22TdT+ cells in intestinal villi. Mean speed and arrest coefficient of Ncr1GFP+Il22TdT+ ILC3s (n = 36) compared to Ncr1GFP−Il22TdT+ cells (n = 95) c, Representative flow cytometry analysis of intestinal Ncr1GFP+Il22TdT+ ILC3s, pregated on CD45+ cells from one of two independent experiments and absolute numbers of Ncr1GFP+Il22TdT+ ILC3s (n = 4 mice per condition) in Ncr1GFPIl22TdT mice treated or not with flagellin 5 h before. d, Time-lapse images (scale bar, 15 µm) of Ncr1GFP+Il22TdT+ ILC3s in intestinal villi 5 h post-flagellin stimulation as in c. Mean speed distribution of intestinal Ncr1GFP+Il22TdT+ ILC3s, with or without flagellin. e–h, Individual tracks (e), mean speed and arrest coefficient (f), distribution of ILC3 patrolling behaviors (g) and MSD (h) of Ncr1GFP+Il22TdT+ ILC3s as in c (n = 29 and 156). Results are from at least nine movies per condition obtained in three independent experiments. Each bar corresponds to the mean ± s.e.m. of the values obtained; only Ncr1GFP+Il22TdT+ ILC3s were tested (*P < 0.05; ***P < 0.001; two-tailed Mann–Whitney U-test; exact P values are provided in the source data).

