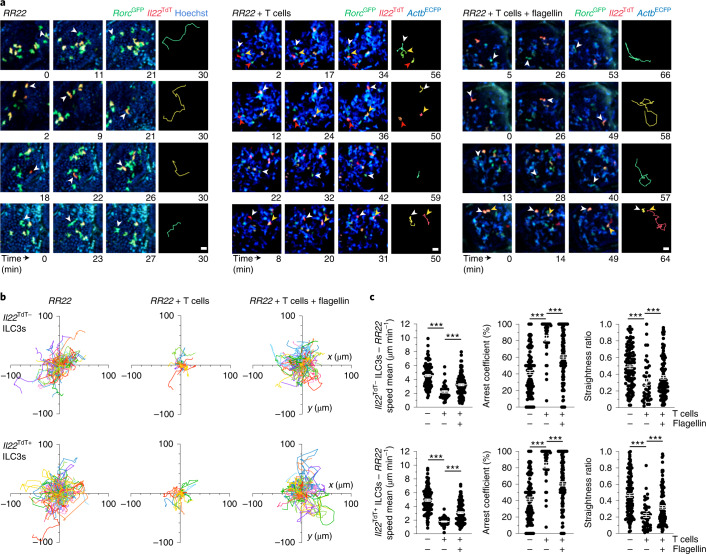
Fig. 3. Local environmental stimuli regulate ILC3 patrolling.
a, Representative time-lapse images (scale bar, 15 µm) of ILC3s within intestinal villi of the indicated mice. Data are representative of three independent experiments. b, Individual tracks of Il22TdT− or Il22TdT+ RorcGFP+ ILC3s in noted mice. c, Mean speed, arrest coefficient and straightness ratio of Il22TdT− and Il22TdT+ ILC3s as in a. Results are from 1–3 movies per condition from 1 of 3 independent experiments (n = 109 and n = 120 for Il22TdT− and Il22TdT+RorcGFP+ ILC3s in RR22 mice, respectively and n = 39 and 120 Il22TdT−RorcGFP+ ILC3s; n = 45 and 109 Il22TdT+RorcGFP+ ILC3s for RR22 + ActbCFP+ T cell mice without or with flagellin, respectively). Each bar corresponds to the mean ± s.e.m. of the values obtained (***P < 0.001; one-way analysis of variance (ANOVA); exact P values are provided in the source data).

