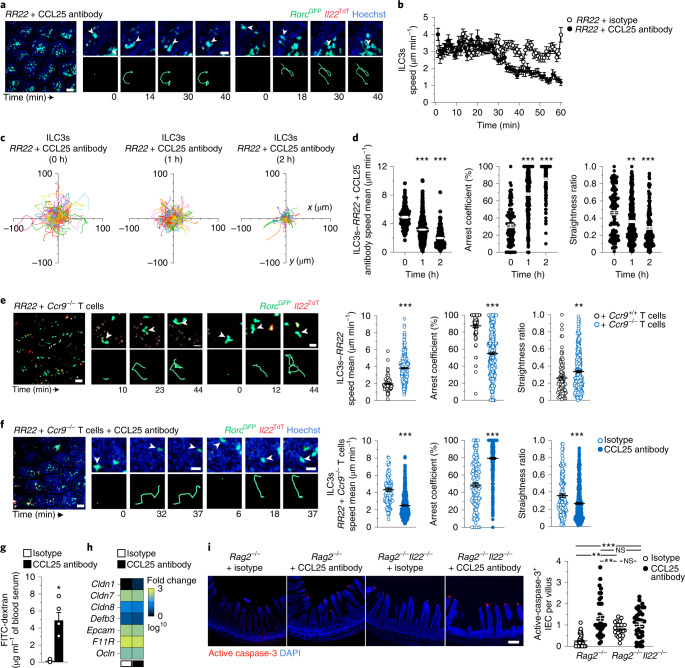
Fig. 5. IEC death is prevented by ILC3 patrolling, which is regulated by CCL25 and T cells.
a–f, Intravital imaging of intestinal ILC3s in RR22 mice injected with isotype or CCL25 antibody (a–d,f), with or without Ccr9+/+ (e) or Ccr9−/− T cells (e,f) showing representative images (left; scale bar, 50 µm), time-lapse images (right; scale bar, 15 µm) of villus ILC3s (a,e,f). Speed over time of intestinal ILC3s in RR22, after either isotype or CCL25 antibody injection at time 0 (b), individual tracks (c), mean speed, arrest coefficient and straightness ratio (d–f) of intestinal ILC3s at 1 h (d–f) and 2 h (d) or 1 h with isotype or CCL25 antibody (b–d), Ccr9+/+ or Ccr9−/− T cells (e), isotype or CCL25 antibody + Ccr9−/− T cells (f). Data are representative of three independent experiments (a,c,e,f). Results in b–f are from at least 2 movies per condition obtained in 2 independent experiments (b–d: n = 121, 0 h; n = 400, 1 h; n = 179, 2 h; e: n = 84, RR22+ Ccr9+/+ T cells and n = 338, RR22+ Ccr9−/− T cells; f: n = 152, isotype and n = 516, CCL25 antibody). g, Intestinal permeability assay in Rag2−/− mice injected intravenously with either isotype or CCL25 antibody 18 h and 4 h before analysis. h, Heatmap of tight junctions and adhesion molecule expression in whole ileum (n = 5) in Rag2−/− mice as in g, detected by Biomark assay. i, Representative immunofluorescence analysis (ileum; scale bar, 50 µm) and absolute numbers of active caspase-3+ IECs in isotype or CCL25 antibody-treated Rag2−/− and Rag2−/−Il22−/−mice. Results in i are from two independent experiments (n = 4 mice Rag2−/− and n = 43 out of 48 fields for each condition; n = 3 Rag2−/−Il22−/− mice and n = 27 out of 37 fields for each condition). Each bar corresponds to the mean ± s.e.m. of the values obtained (NS, not significant; *P < 0.05; **P < 0.01; ***P < 0.001; one-way ANOVA in d–f and two-tailed Mann–Whitney U-test in g–i; exact P values are provided in the source data).

