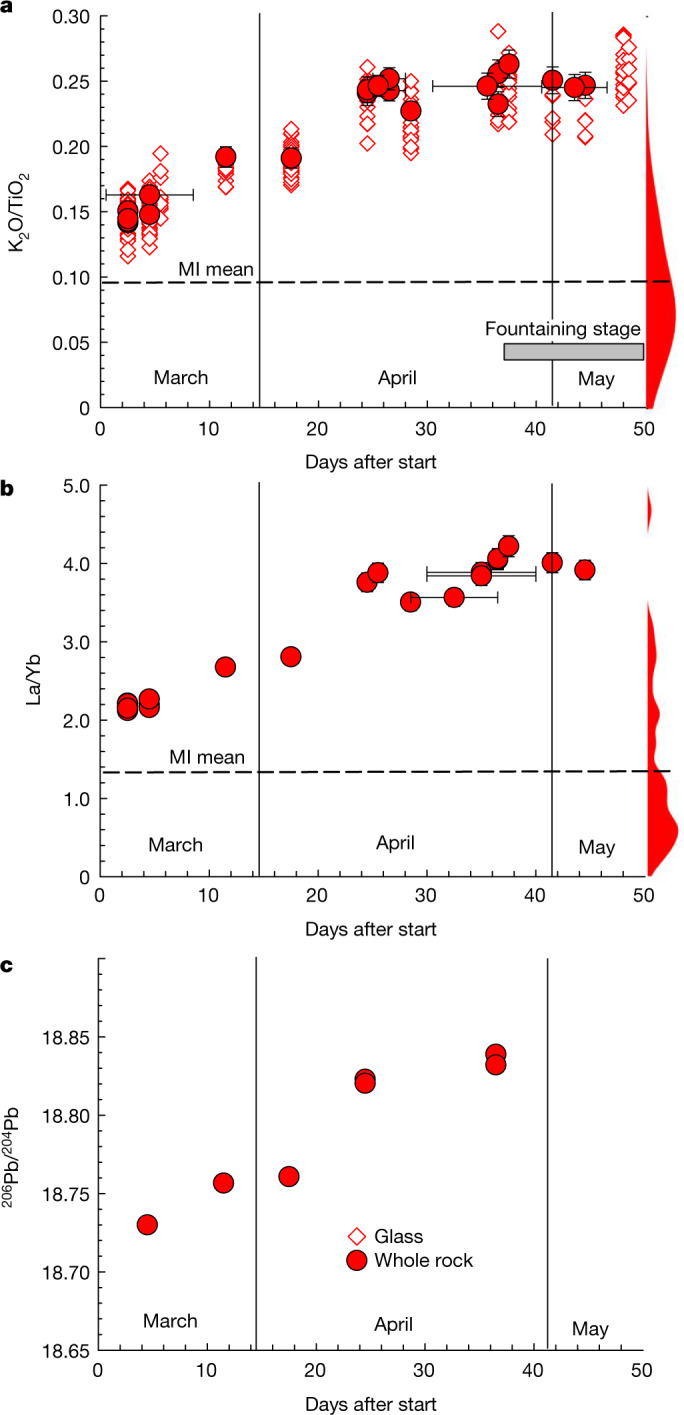
Fig. 3. Temporal trends evident over the course of the first 50 days of 2021 Fagradalsfjall eruption.

a–c, K2O/TiO2 (a), La/Yb (b) and 206Pb/204Pb (c) versus days after start of the eruption. The kernel density estimates on the edges of a and b show the distribution of measured K2O/TiO2 and La/Yb for Fagradalsfjall MIs and the dashed line is the MI mean. The bandwidths are estimated using Scott’s rule: 0.14 for La/Yb and 0.036 for K2O/TiO2. Error bars are included and indicate external 2σ error for geochemical data and a possible range of eruption days when not known precisely. Error bars for 206Pb/204Pb are generally smaller than the symbol. For glass data error estimation, see Extended Data Fig. 2c.
