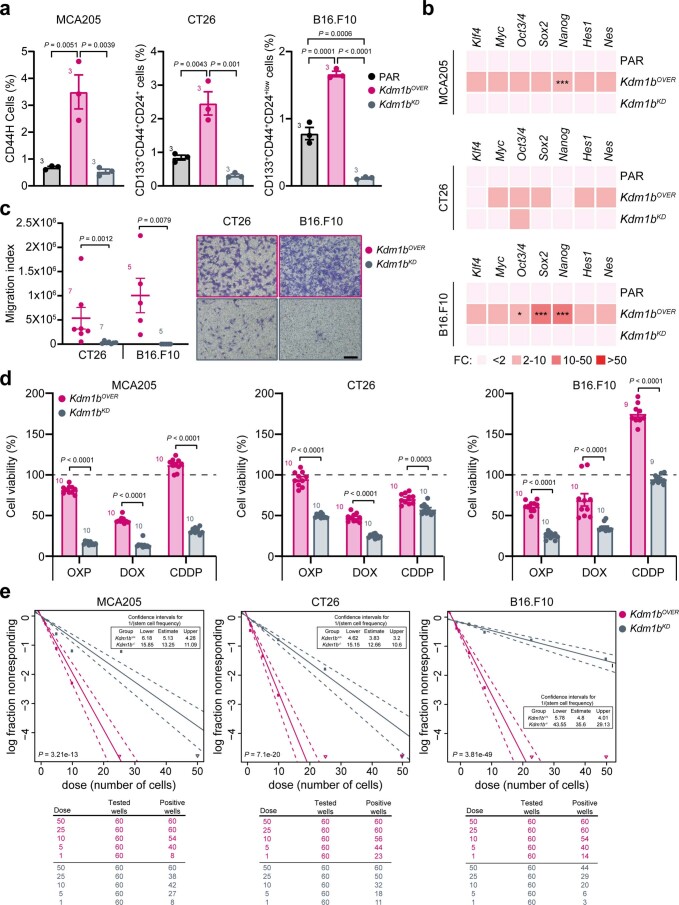
Extended Data Fig. 6. Impact of KDM1B on cancer stemness, tumorigenicity, and invasiveness.
(a,b) Multiparametric flow cytometry analysis of cancer stem cell (CSC) surface markers (a) and qRT–PCR analyses of the reported reprogramming factors (b) in the indicated parental (PAR) cells and the same cell lines engineered to overexpress or down-express KDM1B (Kdm1bOVER and Kdm1bKD). The histograms in (a) represent the percentage (mean ± s.e.m. and individual data points, n = 3 biologically independent experiments) of the indicated CSC subpopulation including CD133+CD24+CD44+high (CD44H) MCA205 cells. qRT–PCR data are reported as mean fold change (FC) over untreated condition after intrasample normalization to Ppia expression levels. *P < 0.05, **P < 0.01, ***P < 0.001; the exact P values are in Supplementary Table 2. (c-e) Evaluation of the assessment of migration ability by transwell assay (c), therapeutic response to the reported immunogenic cell death (ICD) inducers and non inducers (d) and in vitro tumorigenicity and self-renewal potential by ELDA assay (e) in the indicated Kdm1bOVER and Kdm1bKD cells. Number of biologically independent samples (mean ± s.e.m. and individual data points for c and d) collected over three independent experiments is reported. (a,b) Ordinary one-way ANOVA test followed by Bonferroni’s correction as compared to control condition. (c-e) Unpaired two-sided Student’s t-test followed by Welch’s correction and two-tailed Mann–Whitney test. Exact calculations for ELDA assay are in Supplementary Table 2.

