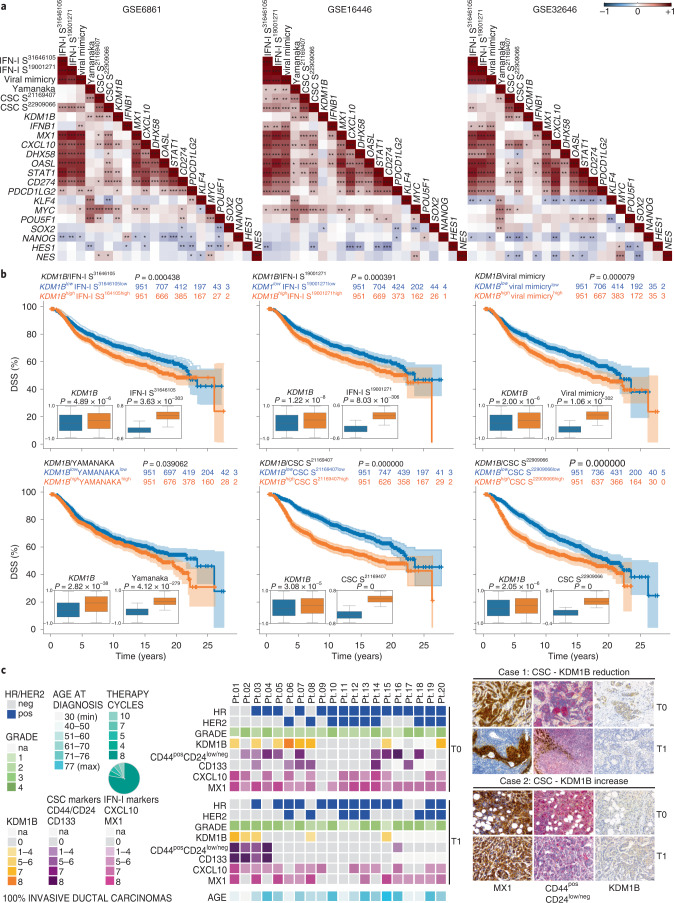
Fig. 7. Correlation between KDM1B, stemness signature and IFN-I signatures in BC patients.
a, Spearman correlations between expression score of KDM1B and the reported IFN-I related metagenes, stem-related reprogramming factors, IFN-I signatures and stemness signatures from microarray data of three publicly available cohorts of BC patients treated with neoadjuvant anthracycline-based chemotherapy. *P < 0.05, **P < 0.01, ***P < 0.001; see Supplementary Table 2 for exact correlation and P values and Extended Data Fig. 7a for other datasets. b, Kaplan–Meier plots depicting the disease-specific survival (DSS) in BC patients from the METABRIC cohort stratified according to risk behavior and boxplots reporting the expression levels of KDM1B and the illustrated stemness or IFN-I signatures across the two groups. P value was calculated using P Cox, log-rank (Mantel–Cox). P values <0.05 were considered statistically significant. The relative expression of the indicated genes and signatures is reported as mean ± s.e.m. from 1,903 patients. For statistics of boxplots see Supplementary Table 3. The correspondent distant relapse-free incidence is reported in Extended Data Fig. 7b. c, IHC analysis of 20 paraffin-embedded paired BC biopsies at T0 (diagnosis) and T1 (surgery) using antibodies to KDM1B, MX1, CXCL10, CD44 + CD24 and CD133. Representative IHC images from sections of two representative patients with reduced (one patient out of four) and increased (one patient out of three) KDM1B/CSC marker score are reported on the right (scale bar, 30 μm). A heatmap reporting relevant information regarding tumor grade, the mutational status of the illustrated genes and the Allred score for all analyzed markers is reported on the left. See also Extended Data Fig. 7 and Supplementary Table 4. na, not available. a, Two-sided Spearman’s rho.

