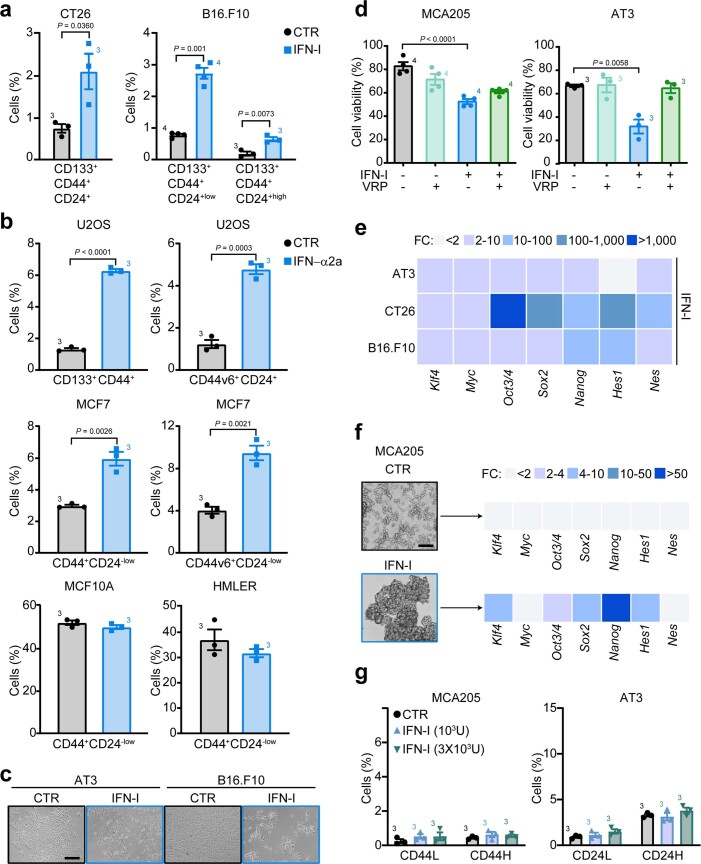
Extended Data Fig. 1. Type I interferon (IFN-I)-mediated enrichment of putative cancer stem cells (CSCs).
(a,b) Multiparametric flow cytometry analysis of the indicated CSC surface markers in CT26 colon carcinoma and B16.F10 melanoma murine cell lines (a), and in U2OS osteosarcoma, MCF7 and HMLER breast carcinoma human cell lines and MCF10A epithelial breast cell line (b). Cells were treated with mock (control, CTR) or purified IFN-I (murine cells) or recombinant IFN-α2a (human cells) (6 × 10³ U ml−1, 72 h). The percentage (mean ± s.e.m. and individual data points, n = 3 and n = 4 independent experiments) of CD133+CD44+CD24+ CT26 cells, CD133+CD44+CD24+low/CD133+CD44+CD24+high B16.F10 cells, CD133+CD44+/CD44v6+CD24+ U2OS cells, CD44+CD24−low/CD44v6+CD24−low MCF7, MCF10A and HMLER cells is shown. (c) Representative pictures of AT3 and B16.F10 epithelial cell morphology under mock or purified IFN-I treatment (n = 3 independent experiments). Scale bar, 100 μm. (d) Flow cytometry analysis showing the proportion of viable (propidium iodide/PI−) MCA205 and AT3 cells left untreated (black) or treated with verapamil (VRP, 100 μM, light green), or purified IFN-I (blue) or VRP + IFN-I (dark green). Data are presented as mean ± s.e.m. and individual data points, n = 3 and n = 4 independent experiments. (e) Expression levels of reprogramming factors in AT3, CT26 and B16.F10 cells treated with purified IFN-I. Data are reported as mean fold change (FC) ± s.e.m. (n = 2 biologically independent samples) over untreated cells after intrasample normalization to the levels of Ppia. (f) Representative images showing the capability of soft-agar-recovered IFN-I-treated MCA205 cells to grow as 3D spheres in standard CSC culture conditions and to maintain a CSC-like transcriptomic profile (n = 2 biologically independent samples). Scale bar, 100 μm. (g) Multiparametric flow cytometry analysis of CD133+CD24+CD44+low (CD44L) and CD133+CD24+CD44+high (CD44H) in MCA205 cells and of CD133+CD44+CD24+low (CD24L) and CD133+CD44+CD24+high (CD24H) in AT3 cells treated for 10 consecutive days with mock or IFN-I (1 × 10³ and 3 × 10³ U ml−1). Representative biparametric plots and a histogram showing the percentage (mean ± s.e.m. with individual data point, n = 3 independent experiments) of CSCs are reported. (a,b) Unpaired two-sided Student’s t-test and unpaired two-sided Student’s t-test with Welch’s correction as compared to CTR cells. (d) Brown–Forsythe and Welch one-way ANOVA followed by Dunnett T3 post-hoc tests. (g) Ordinary one-way ANOVA test followed by Bonferroni’s correction.

