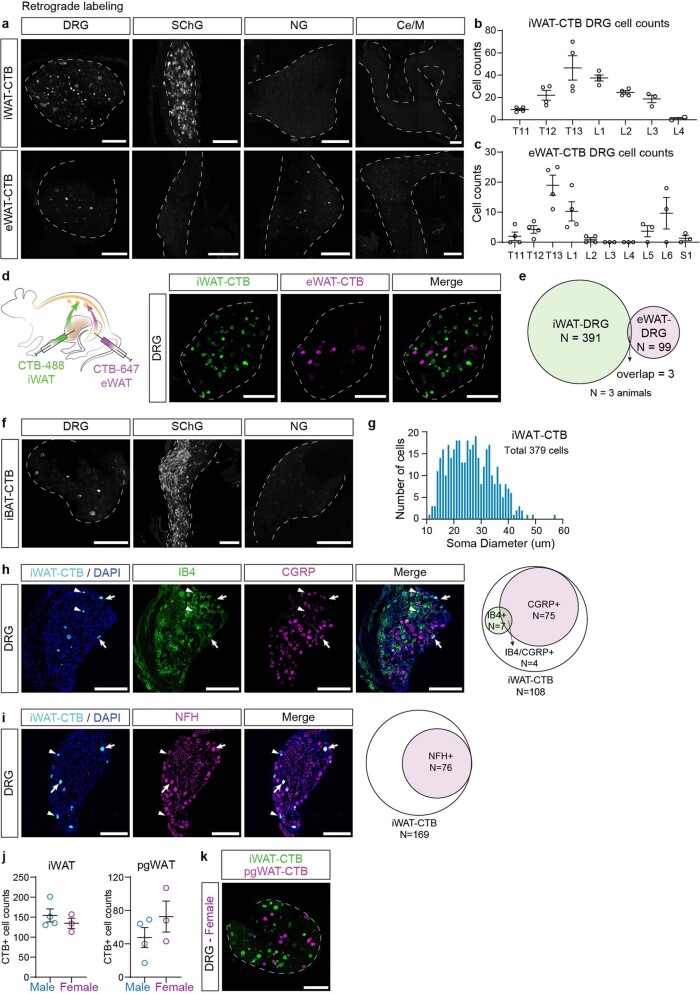
Extended Data Fig. 2. Retrograde labelling confirms somatosensory innervation of adipose tissues.
a, Representative images of DRG (T13), SChG (T12), nodose ganglion (NG), and celiac/superior mesenteric complex (Ce/M) from mice with CTB-647 injected into iWAT or eWAT. b–c, Quantification of CTB labelled cell numbers in DRG labelled from iWAT (b) or eWAT (c) along the vertebral levels. n = 4 per group. d, Schematics of dual-colour CTB labelling from iWAT and eWAT (left) and representative images of T13 DRG. e, Quantification of CTB positive cells from iWAT and eWAT. (n = 3 mice). f, Representative images of DRG (T3), SChG (stellate ganglion and T1 SChG) and NG from mice with CTB-488 injected into iBAT. g, Quantification of CTB labelled DRG soma size distribution from mice with CTB-647 injected into iWAT (n = 3 mice). h–i, Representative images and quantification of cell type of CTB labelled DRG neurons (from 4 mice). j, Quantification of total CTB labelled neurons from DRG (T11-L6) in male and female mice with CTB injected into iWAT or eWAT (n = 4 for male mice, and n = 3 for female mice). k, Representative image of DRG (L1) from female mice with dual-colour CTB labelling from iWAT and pgWAT (from 3 mice). All values are mean ± s.e.m. in b, c, j. Scale bar: 200 μm.

