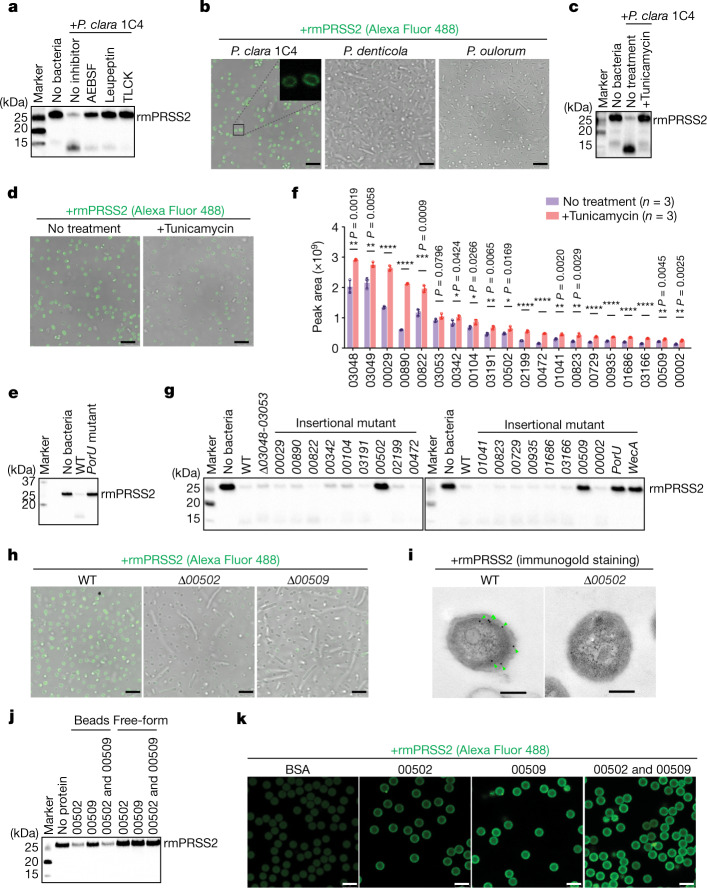
Fig. 3. Identification of effector molecules responsible for Paraprevotella-mediated trypsin degradation.
a, Recombinant mouse trypsin (rmPRSS2) pretreated with the indicated protease inhibitors was incubated with P. clara 1C4, and degradation of rmPRSS2 was analysed using western blotting. b, Alexa Fluor 488-labelled rmPRSS2 (green) was incubated with the indicated species, and association of rmPRSS2 with the bacterial surface was examined using confocal microscopy. The black square indicates the region magnified in the top right, showing P. clara cells. c,d, rmPRSS2 degradation (c) and association with the bacterial surface (d) after incubation with P. clara 1C4 pretreated with tunicamycin or vehicle control. e, rmPRSS2 degradation mediated by WT or PorU-mutant P. clara JCM14859. f, P. clara proteins with elevated levels in the culture supernatants after tunicamycin treatment, as determined by proteome analysis. g, rmPRSS2 degradation mediated by WT or the indicated mutants of P. clara JCM14859. h, Association of rmPRSS2 with the surface of WT or the indicated deletion mutants of P. clara JCM14859. i, Transmission electron microscopy images of WT or Δ00502 strains incubated with rmPRSS2. The green arrowheads indicate immunogold-labelled rmPRSS2. j, rmPRSS2 degradation after incubation with microbead-coupled or free-form recombinant 00502 and/or 00509. k, Association of rmPRSS2 with microbead-coupled recombinant 00502 and/or 00509 or albumin control (BSA). For f, data are mean ± s.d. Each dot represents one technical replicate. Statistical analysis was performed using two-sided multiple unpaired t-tests (not corrected for multiple comparisons); ****P < 0.0001, ***P < 0.001, **P < 0.01, *P < 0.05. Scale bars, 5 μm (b, d, h and k) and 200 nm (i). For a–e and g–k, representative images from two independent experiments with similar results (a–e, g, h, j and k) or images from one experiment (i) are shown. Blot source data are provided in Supplementary Fig. 1.

