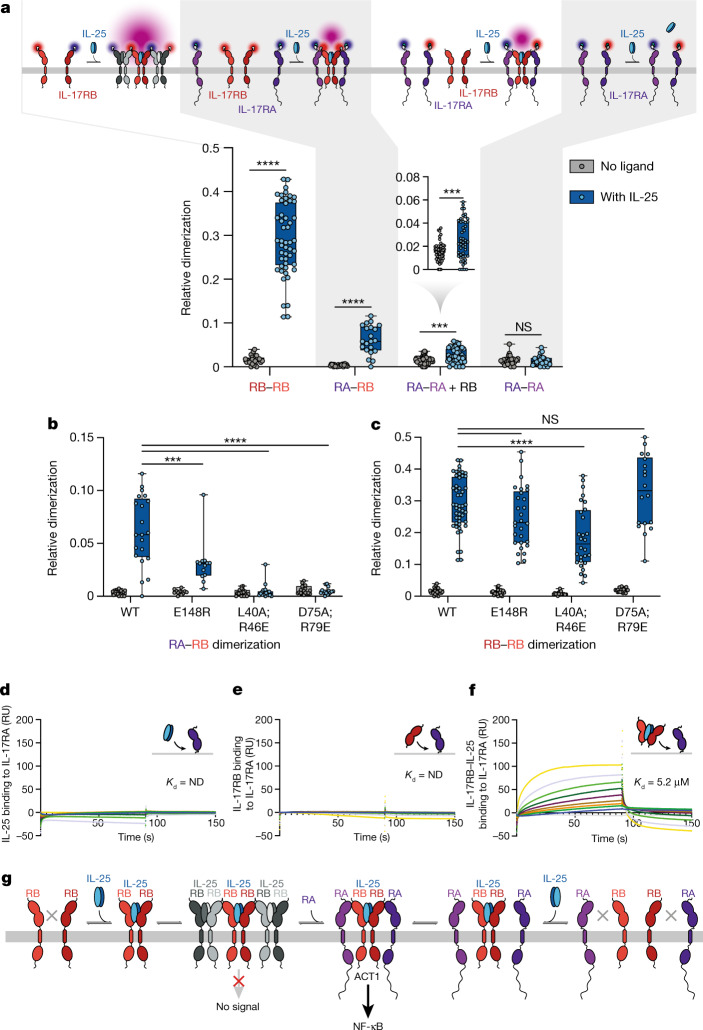
Fig. 4. Quantitative interaction analysis in vitro and in live cells reveals IL-25-induced IL-17RB–IL-17RA binding via the tip-to-tip interface.
a–c, IL-17RB–IL-17RA interactions in the plasma membrane quantified by live-cell single-molecule imaging. a, Different receptor labelling schemes used to interrogate IL-17RB (RB) and/or IL-17RA (RA) homodimerization and heterodimerization by single-molecule co-tracking (top). Box and whisker plots show relative dimerization levels determined by single-molecule co-tracking for homodimerization and heterodimerization of IL-17RA and IL-17RB in the absence and presence of IL-25 (bottom). Numbers of cells and experiments, respectively, are 25 and 4, 49 and 4, 22 and 2, 21 and 2, 51 and 5, 48 and 5, 23 and 2, and 24 and 2 for each column, going from left to right. b,c, Heterodimerization of IL-17RA–IL-17RB (b) and homodimerization of IL-17RB (c) compared with IL-17RB mutations in the IL-17RA–IL-17RB interface. Numbers of cells and experiments, respectively, are 22 and 2, 21 and 2, 12 and 1, 13 and 1, 19 and 2, 18 and 2, 18 and 1, and 17 and 1 for each column in b, and 25 and 4, 49 and 4, 26 and 2, 29 and 2, 17 and 2, 28 and 2, 18 and 1, and 18 and 1 for each column in c, going from left to right. Statistics for a–c were performed using two-sample Kolmogorov–Smirnov tests (not significant (NS); ***P < 0.001 and ****P < 0.0001). Box and whisker plots in a–c show the five number summaries of the data: minimum, first quartile, median, third quartile, and maximum values. d–f, SPR sensorgrams reveal that IL-17RB complexes with IL-25 bind to IL-17RA. The analyte concentration range in d is a twofold serial dilution ranging from 20 to 0.156 µM. The analyte concentration ranges in e and f are twofold serial dilutions from 40 to 0.156 µM. Dissociation constants (Kd) are indicated on the sensorgrams. SPR sensorgrams represent a single experiment (n = 1) for d and one of two independent experiments (n = 2) for e and f. ND, not determined; RU, response unit. g, Model of IL-25–IL-17RB–IL-17RA signalling pathways as inferred from our structural, signalling and biophysical data.

