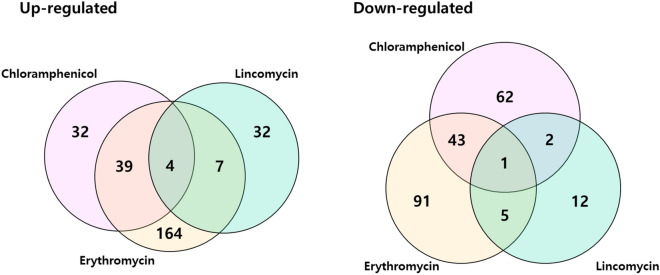
Figure 3.
Venn diagram of differentially expressed genes (DEGs) of S. equorum strain KM1031 following treatment with chloramphenicol, erythromycin and lincomycin. Overlapping regions represent genes that were differentially expressed in strain KM1031 (compared with untreated cells) on treatment with two or three of the antibiotics. The numbers outside overlapping regions indicate the numbers of significantly differentially expressed genes that were affected by each antibiotic individually.

