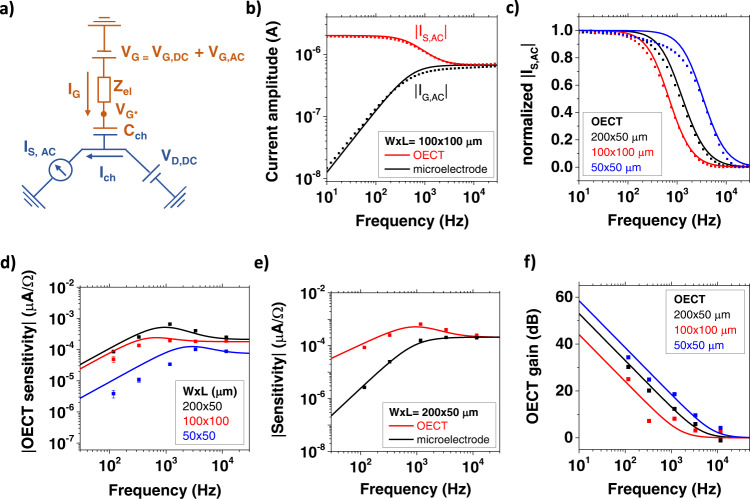
Fig. 2. Quantitative model for PEDOT:PSS-based impedance sensors.
a Equivalent circuit of an OECT during impedance sensing. Orange and blue colors indicate ionic and electronic parts of the circuit, respectively. b Modeling of the current frequency spectra of an OECT and a PEDOT:PSS microelectrode. c Normalized OECT source current amplitudes as a function of the applied frequency for different channel geometries. d OECT sensitivity during the microparticle impedance sensing experiment. The error bars are obtained by averaging between the approach and lift curves of the AFM experiment. e Comparison between the sensitivity of an OECT and a microelectrode having the same dimensions. f OECT gain for different channel geometries.

