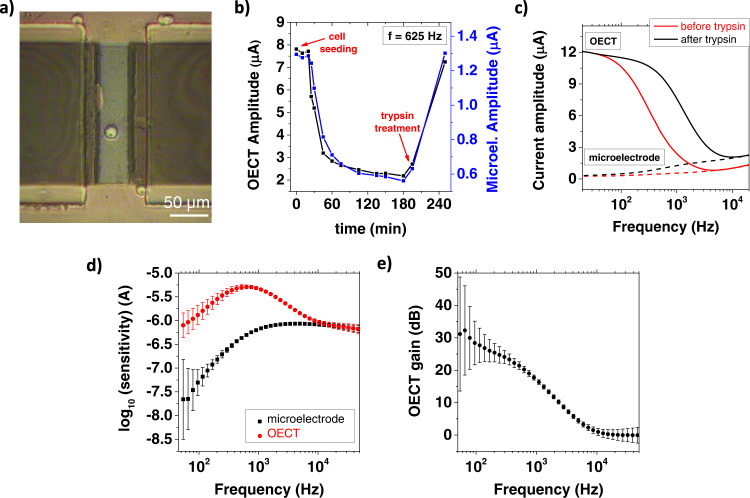
Fig. 3. Single-cell impedance sensor experiment.
a Optical image acquired after seeding a single cell at the center of a PEDOT:PSS sensing channel. b Time evolution of the cell adhesion monitored with an OECT and a microelectrode. c Current spectra acquired in the OECT (straight line) and microelectrode (dashed line) configuration before and after trypsinization. d Experimental OECT and microelectrode sensitivity. Error bars are obtained by averaging between n = 4 measurements acquired at different time. e Experimental OECT gain. Error bars are calculated from the experimental sensitivities by applying Eq. 5.

