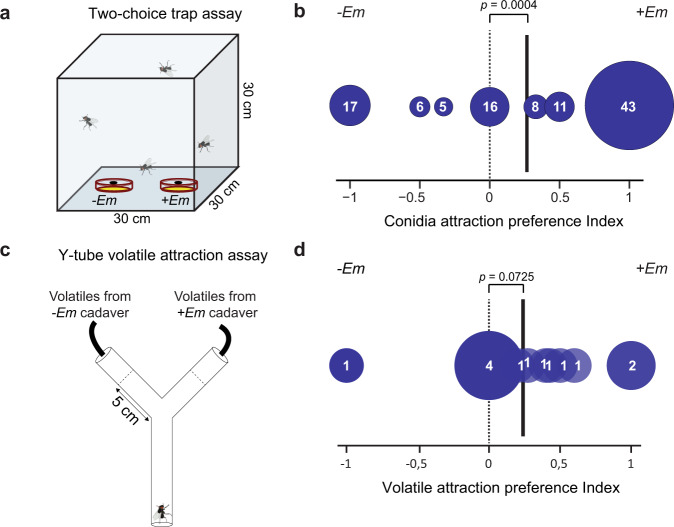
Fig. 2. Behavioural responses to E. muscae volatile compounds.
a Drawing of conidia attraction assay. b Preference index of housefly attraction to volatile chemicals being emitted from visually obstructed sticky-traps with (+Em) and without E. muscae conidia (−Em). Size of circles and numbers within show number of 24-hour trials resulting in a given preference index (four male or female houseflies per trial, 106 trials in total). c Drawing of Y-tube assay set-up. When the test fly reached 5 cm into either arm a choice was noted. d Preference index of male housefly attraction in Y-tube experiments to volatile blends from E. muscae infected female cadavers (+Em) vs. volatiles from uninfected control female cadavers (−Em). Size of circles and numbers within show number of one-hour trials (n = 13) resulting in a given preference index (3–12 male flies per trial, 90 flies in total). Solid black vertical lines designate mean preference index.

