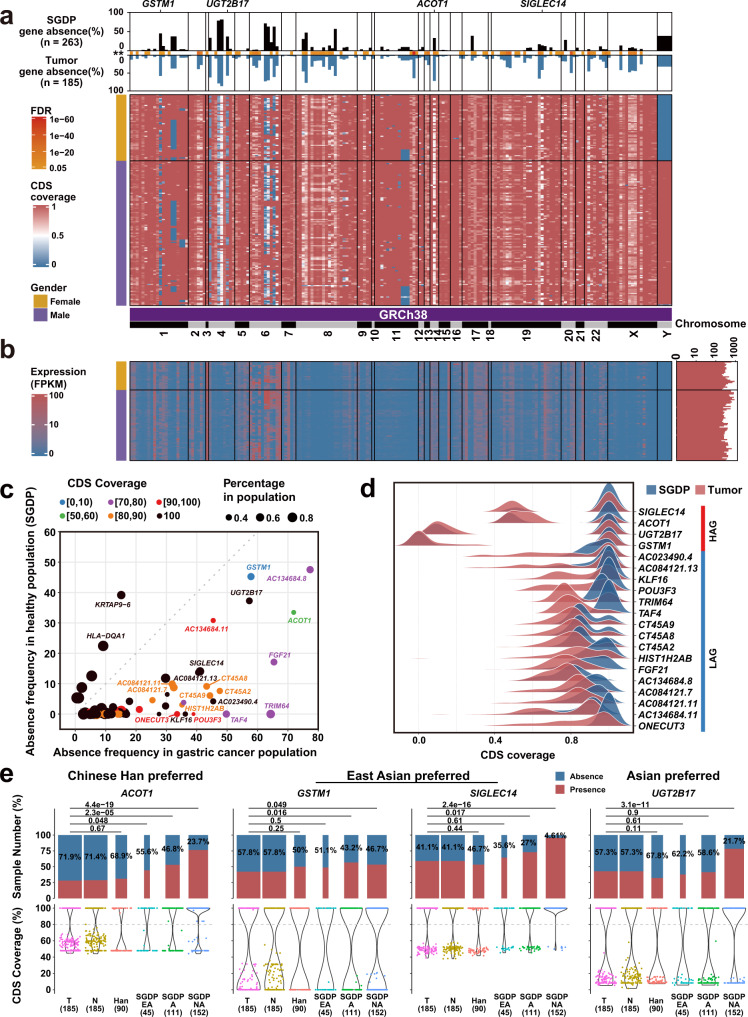
Fig. 2. The PAVs landscape of 186 distributed genes on GRCh38 genes in gastric cancer.
a PAV profile of distributed genes. The top bar plot shows different frequencies of absence variation of distributed genes in SGDP group (black bar) and gastric cancer group (blue bar). The heatmap shows the CDS coverage of distributed genes. The gender phenotype is listed on the left side of the heatmaps. The genes located on GRCh38 are sorted by the physical positions of chromosomes. b The mRNA expression of distributed genes was validated by RNA-seq in 87 cancers. c The distribution features of 78 differential distributed genes between gastric cancer and SGDP groups. X-axis represents the absence frequency of genes in the gastric cancer group (CDS coverage <80%). Y-axis indicates the absence frequency of genes in the SGDP group. The dots in the figure represent genes. The dot color is determined by the largest proportion of a gene’s CDS coverage. Black color means 100% CDS coverage. d The top 20 distributed genes could be divided into highly absent genes (HAG: SIGLEC14, ACOT1, UGT2B17, and GSTM1) and low absent genes (LAG: others). e Comparison of gene absence frequencies in different populations for the four HAGs (Fisher’s exact test). T: cancer; N: Normal; Han: the 90 Han Chinese dataset; SGDP EA: East Asian in SGDP dataset, A: Asian in SGDP dataset, NA: Non-Asian in SGDP dataset.

