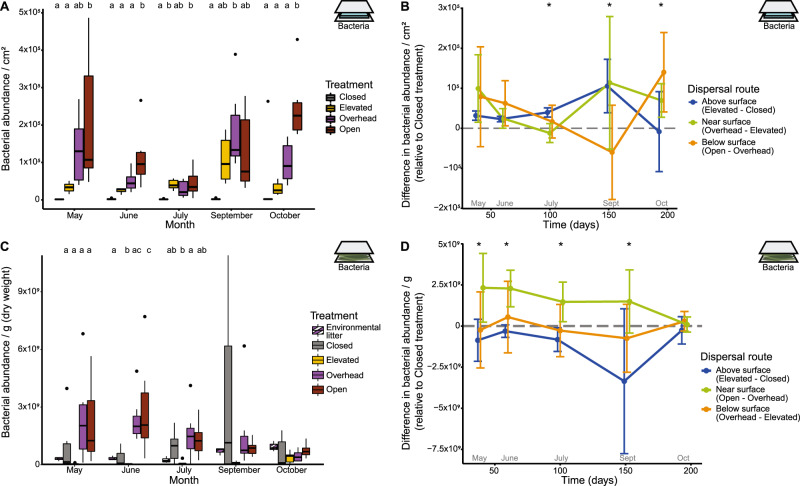
Fig. 2. Bacterial abundance.
A Bacterial abundance on the dispersal slides is significantly predicted by treatment (ANOVA: p < 0.0001, R2 = 0.30, F = 26.18), month (p < 0.0001, R2 = 0.11, F = 7.18), and the interaction between treatment and month (p < 0.001, R2 = 0.15, F = 3.20). Abundance differs by treatment in all months (p < 0.05). Letters indicate pairwise significance within each significant month (Tukey’s HSD). C Bacterial abundance in the litterbags is significantly predicted by both treatment (p = 0.00026, R2 = 0.12, F = 6.87) and the interaction between treatment and month (p = 0.015, R2 = 0.19, F = 2.06). Abundance differs by treatment for the first three months (p < 0.05) but not September (p = 0.12) or October (p = 0.53). Environmental litter is provided for context but was not included in statistical analyses. Abundance by dispersal route is calculated by the difference between treatments (Table S1) for B dispersal slides and D litterbags. Asterisks indicate that abundance differed by dispersal route (post hoc ANOVA: p < 0.05). Error bars represent 95% confidence intervals. Icons located in the top right of each panel indicate which experiment is being described: a blue slide for the dispersal slide experiment and green vegetation for the leaf litter experiment.

