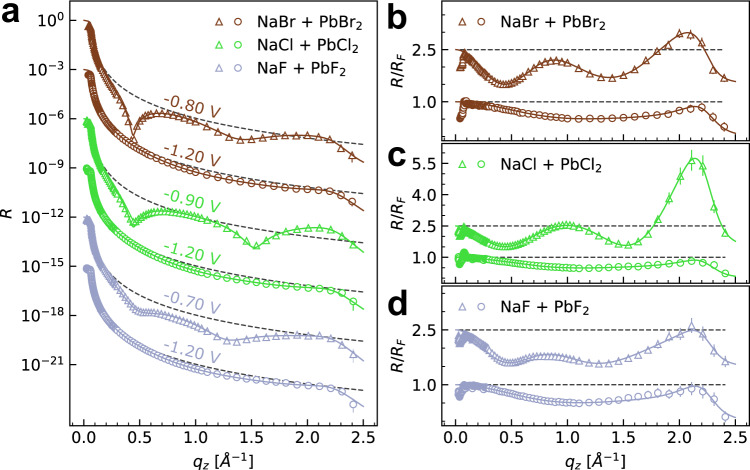
Fig. 2. Structural data for the Hg interface structure in Pb halide solutions.
a X-ray reflectivity R and b–d R normalized by the Fresnel reflectivity RF (indicated by dashed gray lines) of Hg electrodes in 0.01 M NaBr + 0.25 mM PbBr2 (brown symbols), 0.01 M NaCl + 0.25 mM PbCl2 (green symbols), and 0.01 M NaF + 0.12 mM PbF2 (blue symbols). Triangles indicate curves measured at −1.20 V, open circles curves were measured in the potential range of de-amalgamation, at −0.80 V (brown), −0.90 V (green), and −0.70 V (blue). For clarity, subsequent profiles in a are offset by a factor of 1000 and the profiles in b–d are offset by a factor of 2.5. Solid lines correspond to the best fits with the models discussed in the text. The error bars represent the instrumental errors, resulting from the counting statistics of signal and background.

