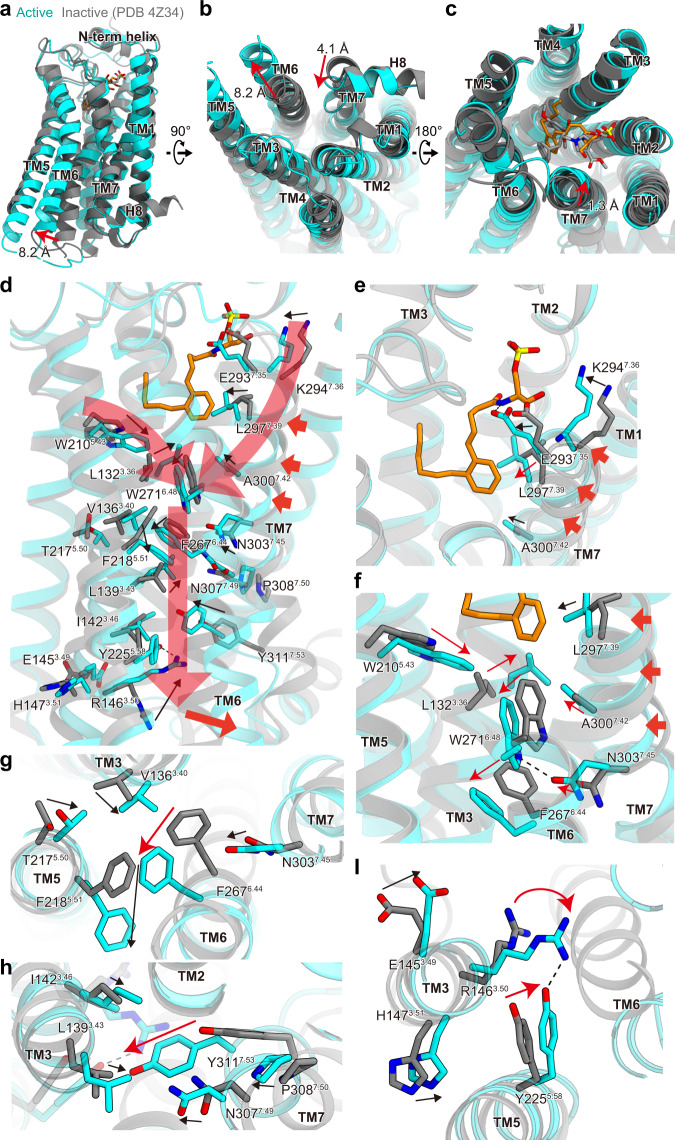
Fig. 4. Comparison of the agonist- and antagonist-bound LPA1 structures.
Superimposition of the agonist- and antagonist-bound LPA1 structures, colored cyan and gray (PDB 4Z34), respectively, viewed from the membrane plane (a), the intracellular side (b), and the extracellular side (c). D251 in TM6 and Y311 in TM7 are shifted by about 8.2 and 4.1 Å, respectively. d–f Structural changes of the intramolecular interactions induced by agonist binding (d). Panels (e) and (f) are focused on the extracellular side of TM7 and the receptor core, respectively. Rearrangement of the PIF (g), NPxxY (h), and DRY (I) motifs upon receptor activation. Hydrogen bonds are indicated by black dashed lines.

