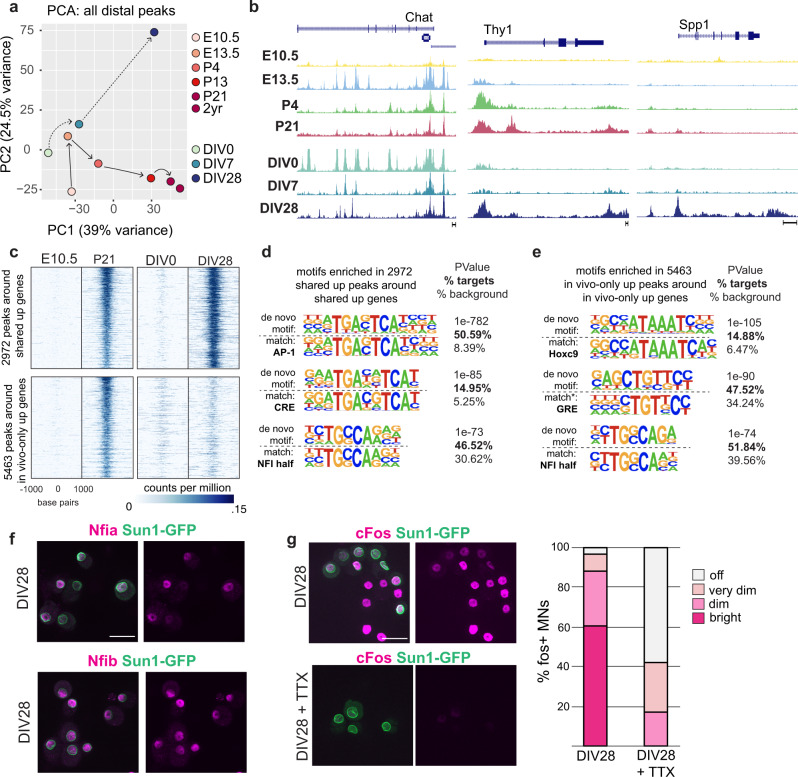
Fig. 5. Identification of shared and in vivo-specific regulators of maturation.
a Principal component analysis on in vivo and in vitro datasets based on all distal ATAC-seq peaks. Each circle is the cumulative ATAC-seq data from two biological replicates. b ATAC-seq reads around a continuously expressed gene (Chat) and genes upregulated during maturation (Spp1 and Thy1). c Heatmaps of ATAC-seq reads. Each panel spans ±1 kb from the center of peaks. Top: peaks upregulated both in vivo and in vitro around shared upregulated genes. Bottom: peaks upregulated only in vivo around genes upregulated only in vivo. d, e Motifs enriched in top (d) and bottom (e) genomic regions from (c). HOMER outputs show the de novo motif (top) and the best-matched known transcription factor motif (bottom) along with p value and prevalence. f Immunostaining of Nfia and Nfib in DIV28 cultures. g Immunostaining and scoring of Fos in DIV28 cultures in the absence and presence of TTX. All scale bars are 50 μm.

