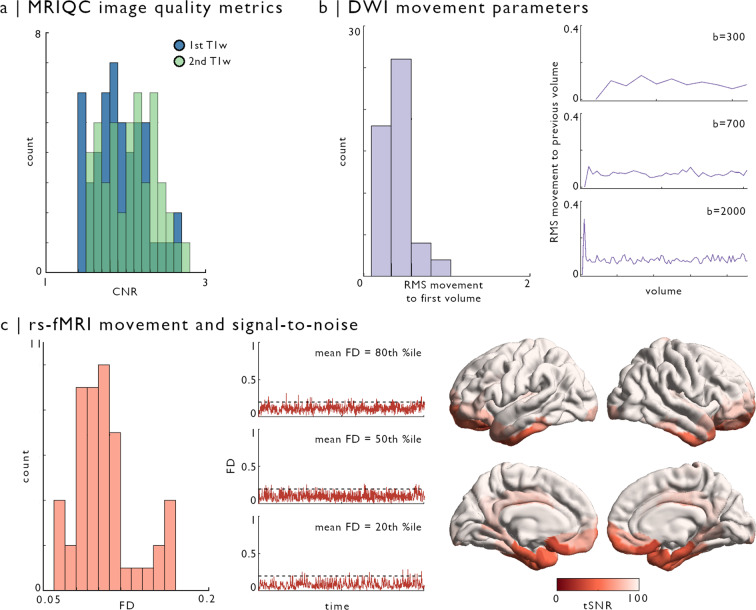
Fig. 3.
Image quality metrics across sequences. (a) Contrast-to-noise (CNR), estimated with MRIQC87, showed no outliers in either T1w scan (first scan in blue, second scan in green). (b) Motion parameters of diffusion-weighted images were obtained from FSL eddy89. The histogram illustrates root mean squared (RMS) voxel-wise displacement relative to the first volume across all shells. Line plots show RMS displacement in each volume relative to the previous volume. (c) Framewise displacement (FD) of resting-state functional scans was obtained using FSL motion outliers, reflecting the average of rotation and translation parameter differences at each volume92. The histogram shows subjects-wise average FD across volumes. Line plots show FD across resting-state acquisitions for three participants, with respectively 20th, 50th, and 80th percentile average FD across our sample. Dashed line indicates 0.2 mean FD threshold used for exclusion of participants with excessive motion. Vertex-wise temporal signal-to-noise (tSNR) was calculated on the native surface of each participant. Computed tSNR values were averaged within a 400-node functional parcellation (Schaefer-400) and averaged across individuals.

