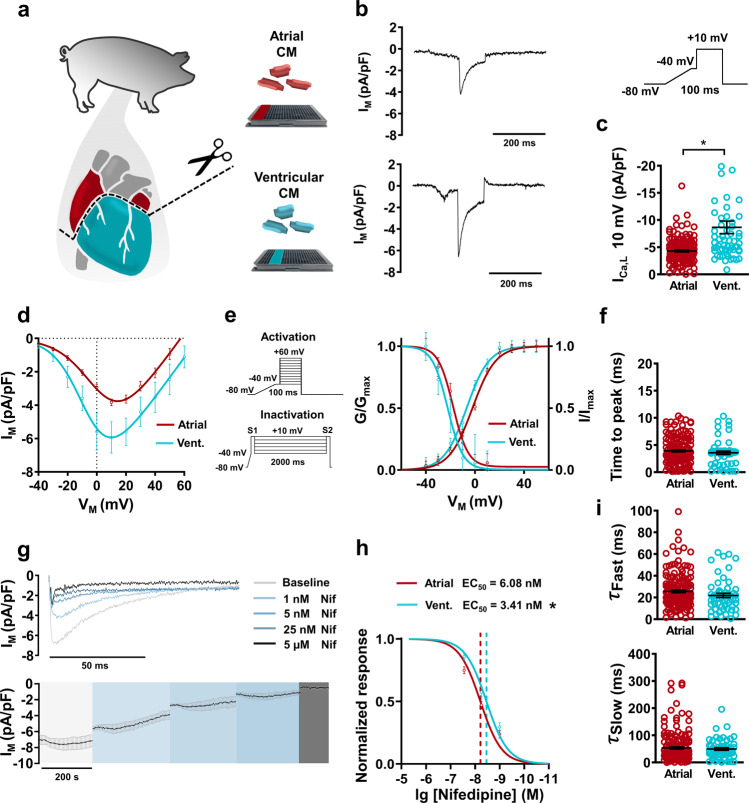
Fig. 3. L-type calcium current (ICa,L) acquisition and analysis from native atrial and ventricular cardiomyocytes (CM) using automated patch-clamp.
a Schematic of swine cardiac tissue harvesting and CM isolation. b Representative recordings of membrane current (IM) showing ICa,L in atrial and ventricular (vent.) CMs. Inset: Voltage protocol. c Peak ICa,L density measured at +10 mV. d Current–voltage (I–V) relationship curves for ICa,L in atrial (n = 71) and ventricular (n = 26) CMs. e Voltage protocols for I–V/activation experiments and S1/S2 voltage protocols for ICa,L inactivation. Graph shows ICa,L activation (G/Gmax) in atrial (n = 71) and ventricular (n = 26) CMs, with corresponding inactivation(I/Imax) curves in atrial (n = 15) and ventricular (n = 6) CMs. f Activation kinetics of ICa,L at +10 mV expressed as a time to peak amplitude. g Representative concentration-dependent response to nifedipine (Nif) application in ICa,L current with a time course of average ICa,L from a single plate following nifedipine application (n = 10). h Concentration-response curve of ICa,L (normalized to the current amplitude at the full block with 5 µM Nif) following nifedpine application in atrial and ventricular CMs with corresponding half maximal effective concentration (EC50). I Biphasic inactivation kinetics of ICa,L at +10 mV expressed as fast decay (τfast) and slow decay (τslow). Data are mean ± SEM from three animals. *P < 0.05 vs. ventricular. n = number of atrial (176) and ventricular (58) CMs from 3 animals (c, f, i) or atrial (94) and Ventricular (39) (h).

