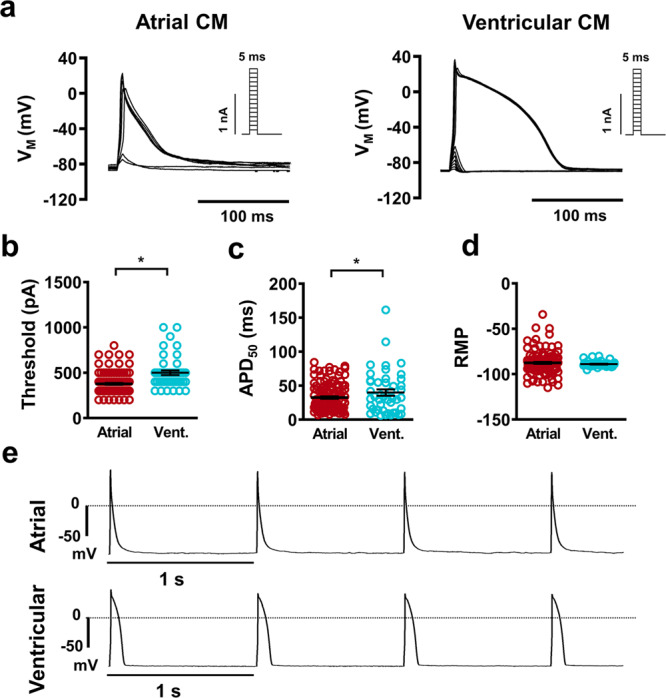
Fig. 4. Action potential (AP) acquisition from native atrial and ventricular cardiomyocytes (CM) using automated patch-clamp.

a Representative traces membrane voltage (VM) showing atrial and ventricular (vent.) triggered APs during successive increases in pulse current injection. Insets: current protocol. b Current at which AP take-off was first observed. c AP duration at 50% repolarization (APD50). d Resting membrane potential (RMP) quantification. e Representative traces of AP trains at 1 Hz show stable RMP between pulses. Data are mean ± SEM. *P < 0.05 vs. ventricular. n = number of atrial (127) and ventricular (45) CMs from 3 animals (b–d).
