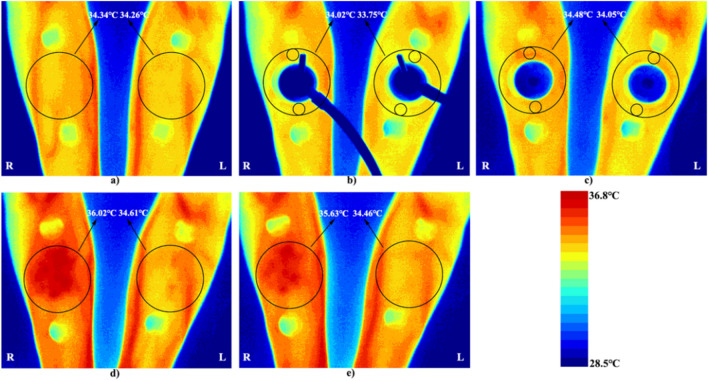
Figure 3.
Measurement of the skin temperature of the cupping site at different stages of the experiment using IRT. ROIs are marked with black circles. (a) The basal temperature before cupping is measured. (b) Cupping is started at − 0.03 MPa on the left and − 0.04 MPa on the right. The mean temperature in the ROI is represented by the average temperature of two small circular regions. (c) Cupping is maintained. (d) 500 s after cupping. (e) 1800 s after cupping. R right, L left.

