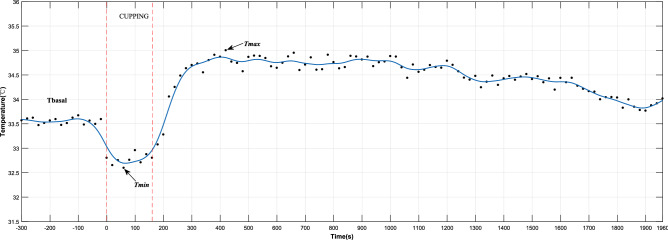
Figure 4.
Time-dependent skin temperature changes induced by negative pressure (− 0.04 MPa) in a representative subject. The black dots represent the temperature series sampled in the experiment. The blue curve is obtained from these data using smooth spline fitting, and is divided into three stages by the red dash-dotted lines: basal stage, cupping stage and recovery stage. In these three stages, the three parameters (Tbasal, Tmin, and Tmax) indicated by the arrows were used to quantify the dynamic change limits of skin temperature. Table 2 shows the detailed definition of these parameters.

