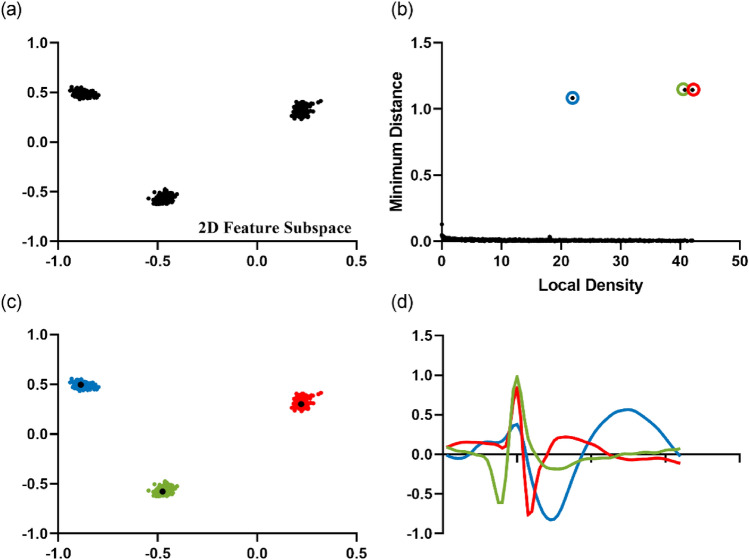
Figure 1.
Running scenario of the DP clustering stage using Dataset C1_005. (a) Data points projected in a two-dimensional feature subspace after LDA. This subspace is considered to be optimal for the within-class scatters are relatively small and intra-class scatters are relatively large. (b) Schematic diagram with the local density and the minimum distance as the horizontal and vertical axes. The points circled in three colors are the screened cluster centers. (c) Scatter plot of 3 clusters obtained by DP. The three colors of red, green and blue respectively represent the clustering results of cluster 1, cluster 2 and cluster 3. The black dots represent the cluster centers. (d) The waveforms of three cluster centers.

