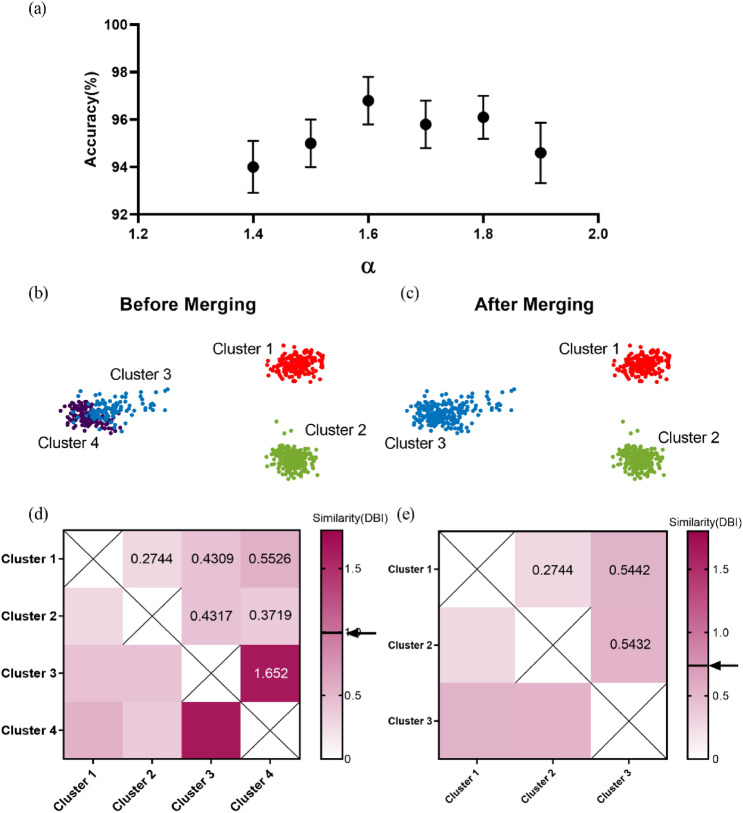
Figure 2.
An illustration of determining the number of clusters. (a) Accuracy on all testing sets in dataset A versus threshold coefficient . The error bars represent the standard error of the mean. (b,c) The results of classification before and after merging. Before merging, data points are clustered into four clusters (denoted by four colors: red, violet, green and blue), while after merging, we obtain three clusters (denoted by three colors: red, green and blue). (d) Heatmap of similarity between clusters before merging. The black solid line and the arrow mark the threshold (threshold = 0.99, see Formula (14)). It can be seen from the heatmap, the similarity between cluster 3 and cluster 4 is above the threshold, thus merging cluster 3 and cluster 4. (e) Heatmap of similarity between clusters after merging. At this time the number of clusters is 3, and the similarity between clusters is below the threshold (threshold = 0.73, see Formula (14)), the merging stage terminates. The number of clusters is finally determined to be 3.

