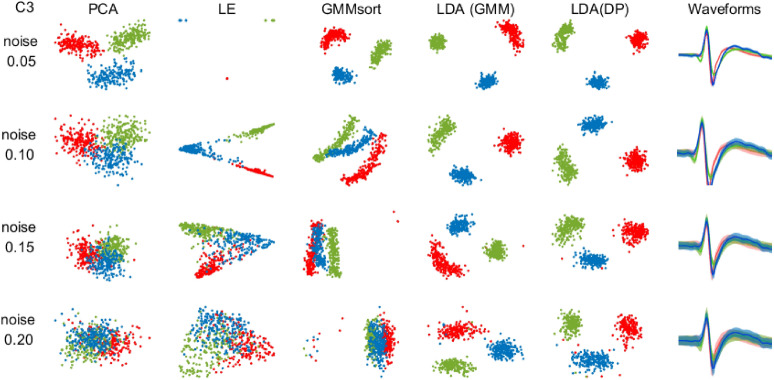
Figure 3.
Two-dimensional feature subspace for algorithms on dataset C3 under four noise levels. For comparing the feature extraction capability of each algorithm, the data points were colored according to the ground truth. Red, green and blue dots represent the features extracted from three clusters, respectively. The last column shows the average spike waveforms of three clusters obtained by LDA-DP, and the shaded part represents the standard deviation.

