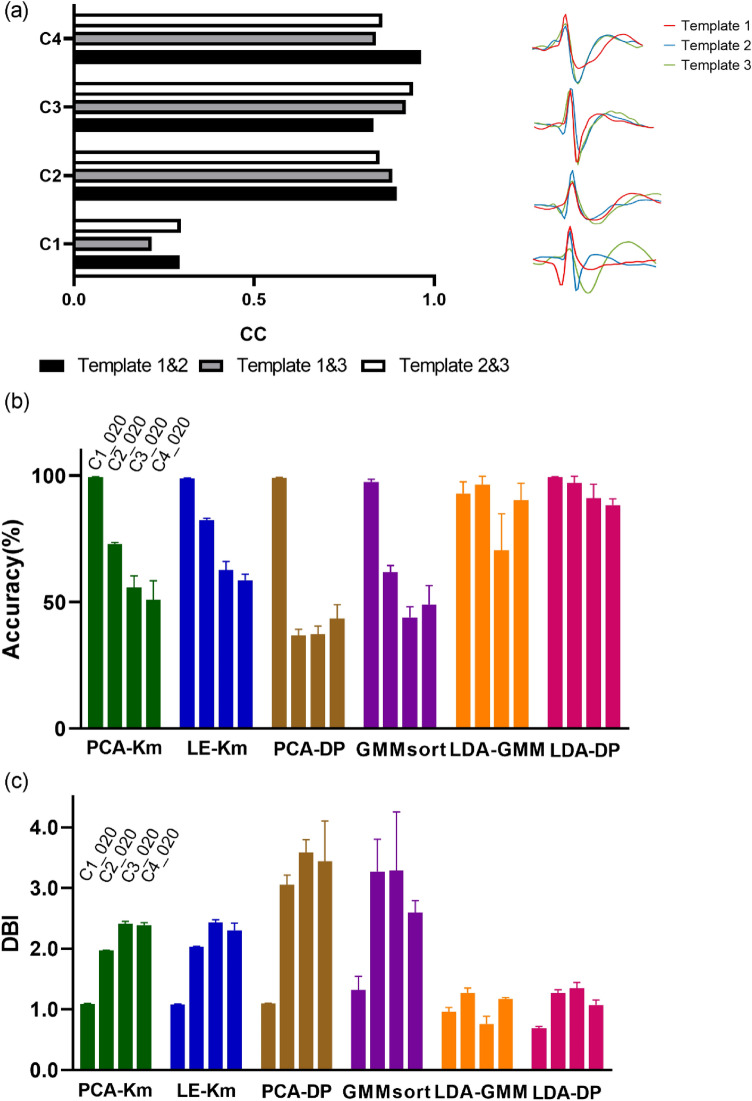
Figure 5.
The sorting performance of 6 spike sorting algorithms concerning waveform similarity using the testing set C1_020, C2_020, C3_020 and C4_020. (a) Comparing the similarity of waveform templates in four testing sets. Left: bar graph of the correlation coefficient (CC) of the three waveform templates for four datasets. Black, gray and white respectively represent CC of template 1 and template 2, CC of template 1 and template 3, and CC of template 2 and template 3. Right: Waveform templates of each testing set. Red, blue and green represent template 1, template 2 and template 3, respectively. (b) Bar graph of sorting accuracy of 6 spike sorting algorithms on the testing set C1_020, C2_020, C3_020 and C4_020. Error bars represent s.e.m. (c) Bar graph of DBI of 6 spike sorting algorithms on the testing set C1_020, C2_020, C3_020 and C4_020. Error bars represent s.e.m.

